
 Email
Email SMS
SMS Whatsapp
 Web Push
 App Push
 Popups
 Channel A/B Testing
  Control groups Analysis
 Frequency Capping
 Funnel Analysis
 Cohort Analysis
 RFM Analysis
 Signup Forms
 Surveys
 NPS
NPS Landing pages personalization
  Website A/B Testing
  PWA/TWA
 Heatmaps
 Session Recording
 Wix
Wix Shopify
 Magento
 Woocommerce
 eCommerce D2C
  Mutual Funds
 Insurance
 Lending
  Recipes
  Product Updates
 App Marketplace
 Academy
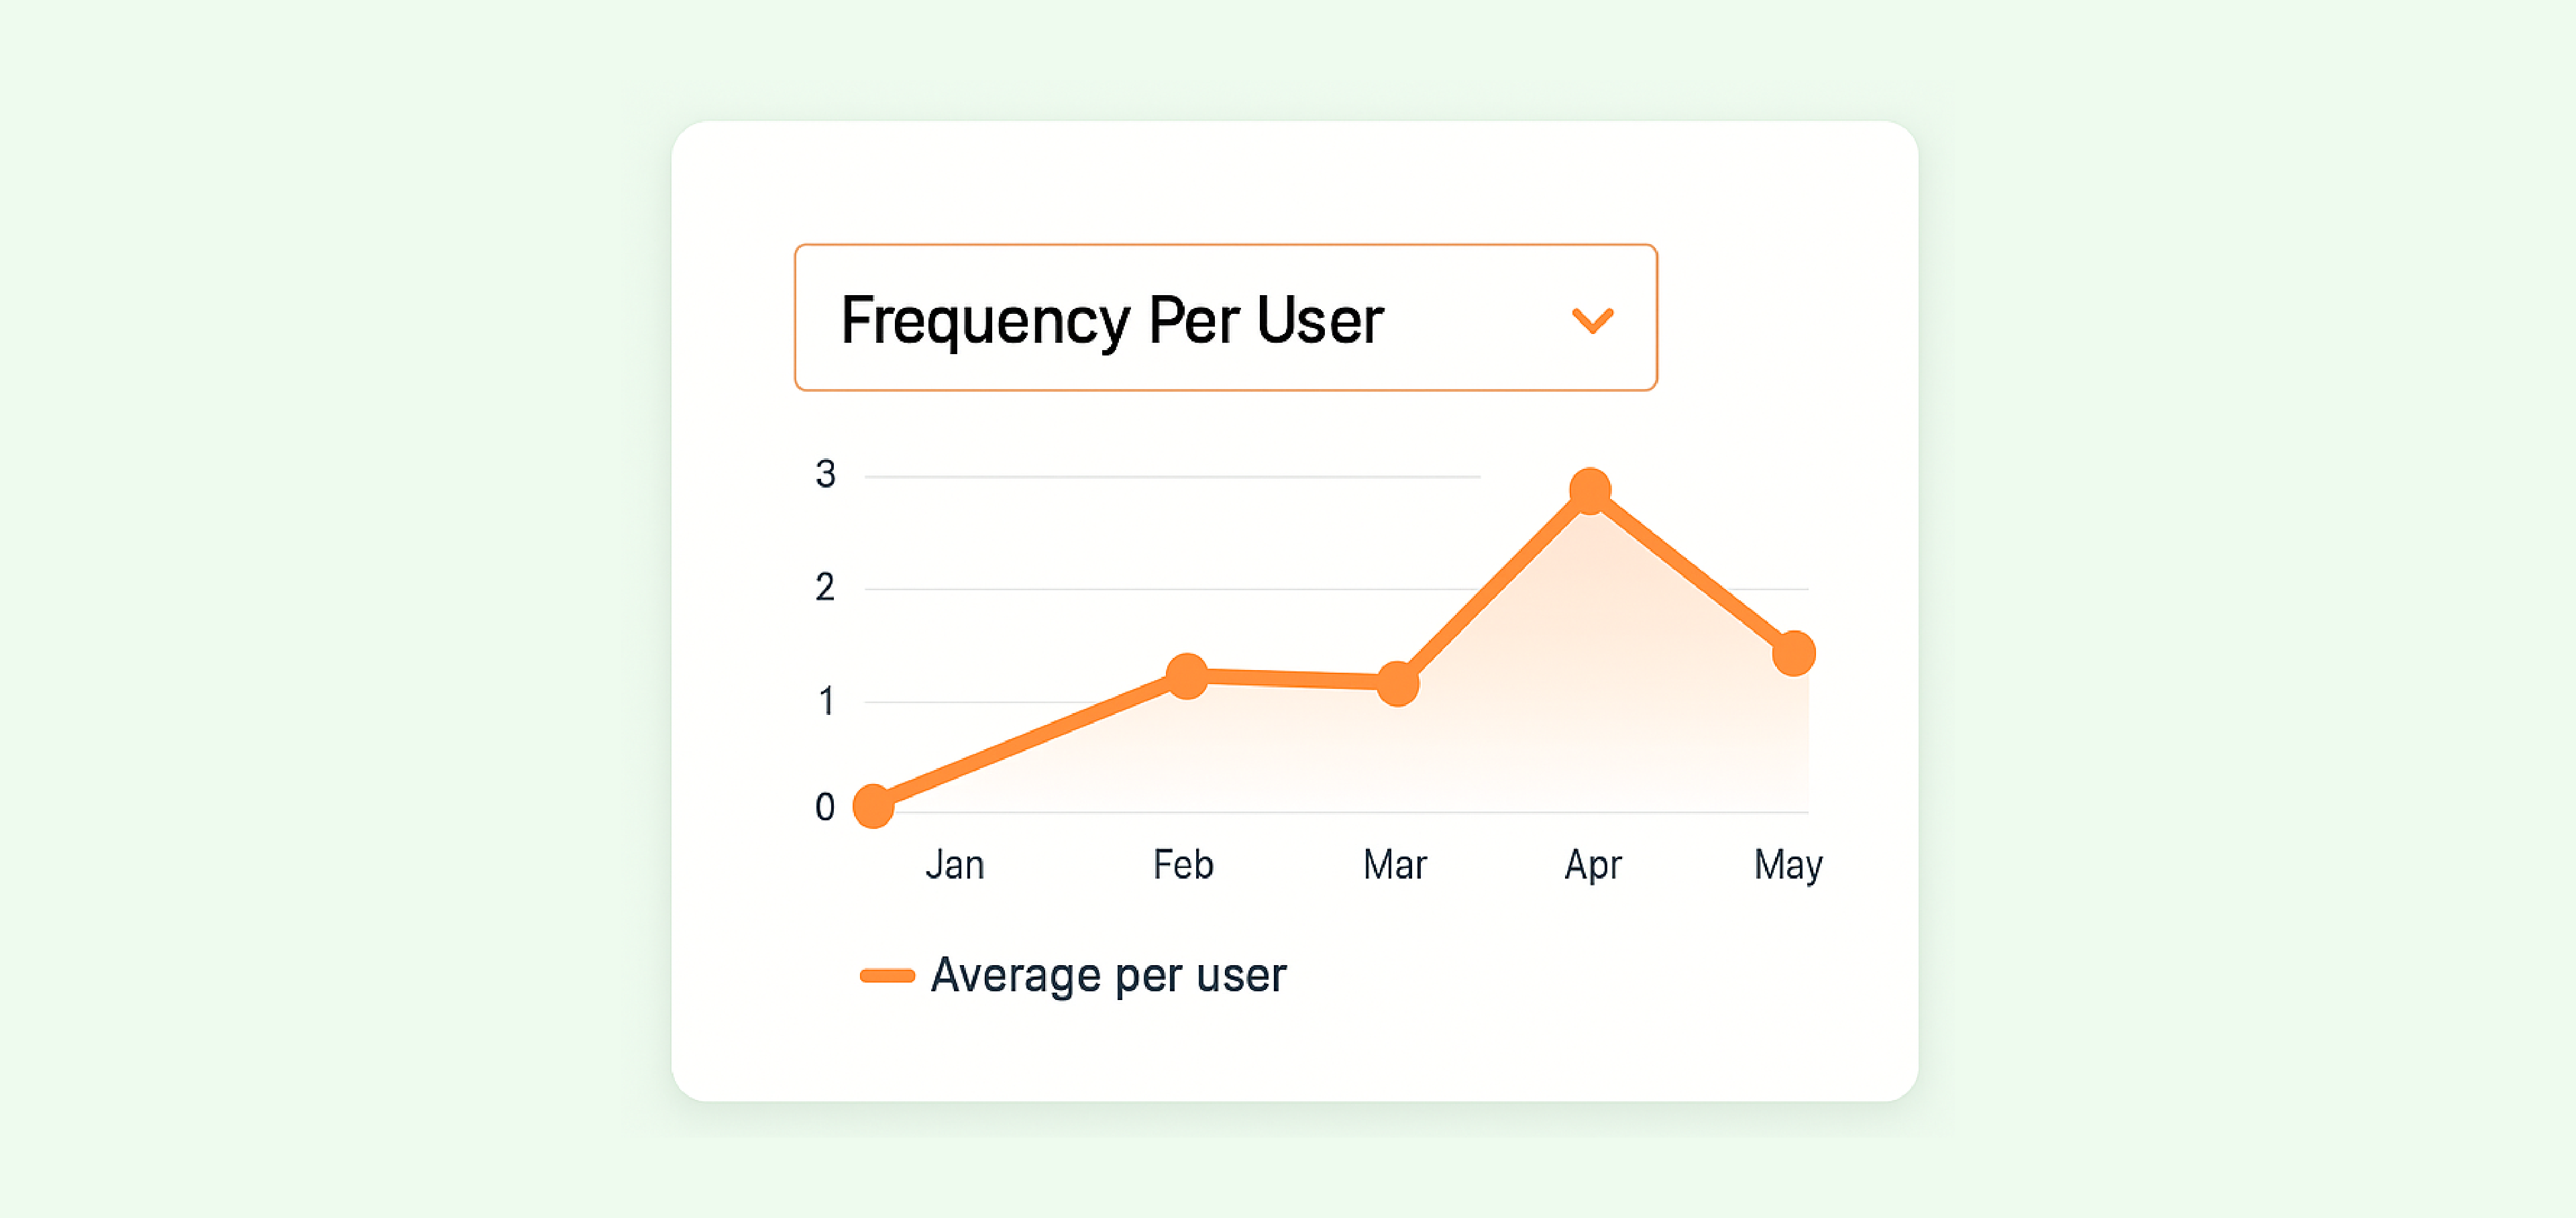
We’ve added a Frequency Per User trend option to Insights reports, helping you understand how often users perform a specific event on average.
Why it’s useful:
This metric shows the average number of times each user performs an event, giving you a better view of engagement patterns.
Example:
If an Order Placed event happens 100 times across 50 users, the frequency per user is: 100/50 = 2. This means, on average, each user placed 2 orders.
How to use it:
- In your Insights report, select the event you want to analyze.
- From the Select Event Trend dropdown, choose Frequency Per User.
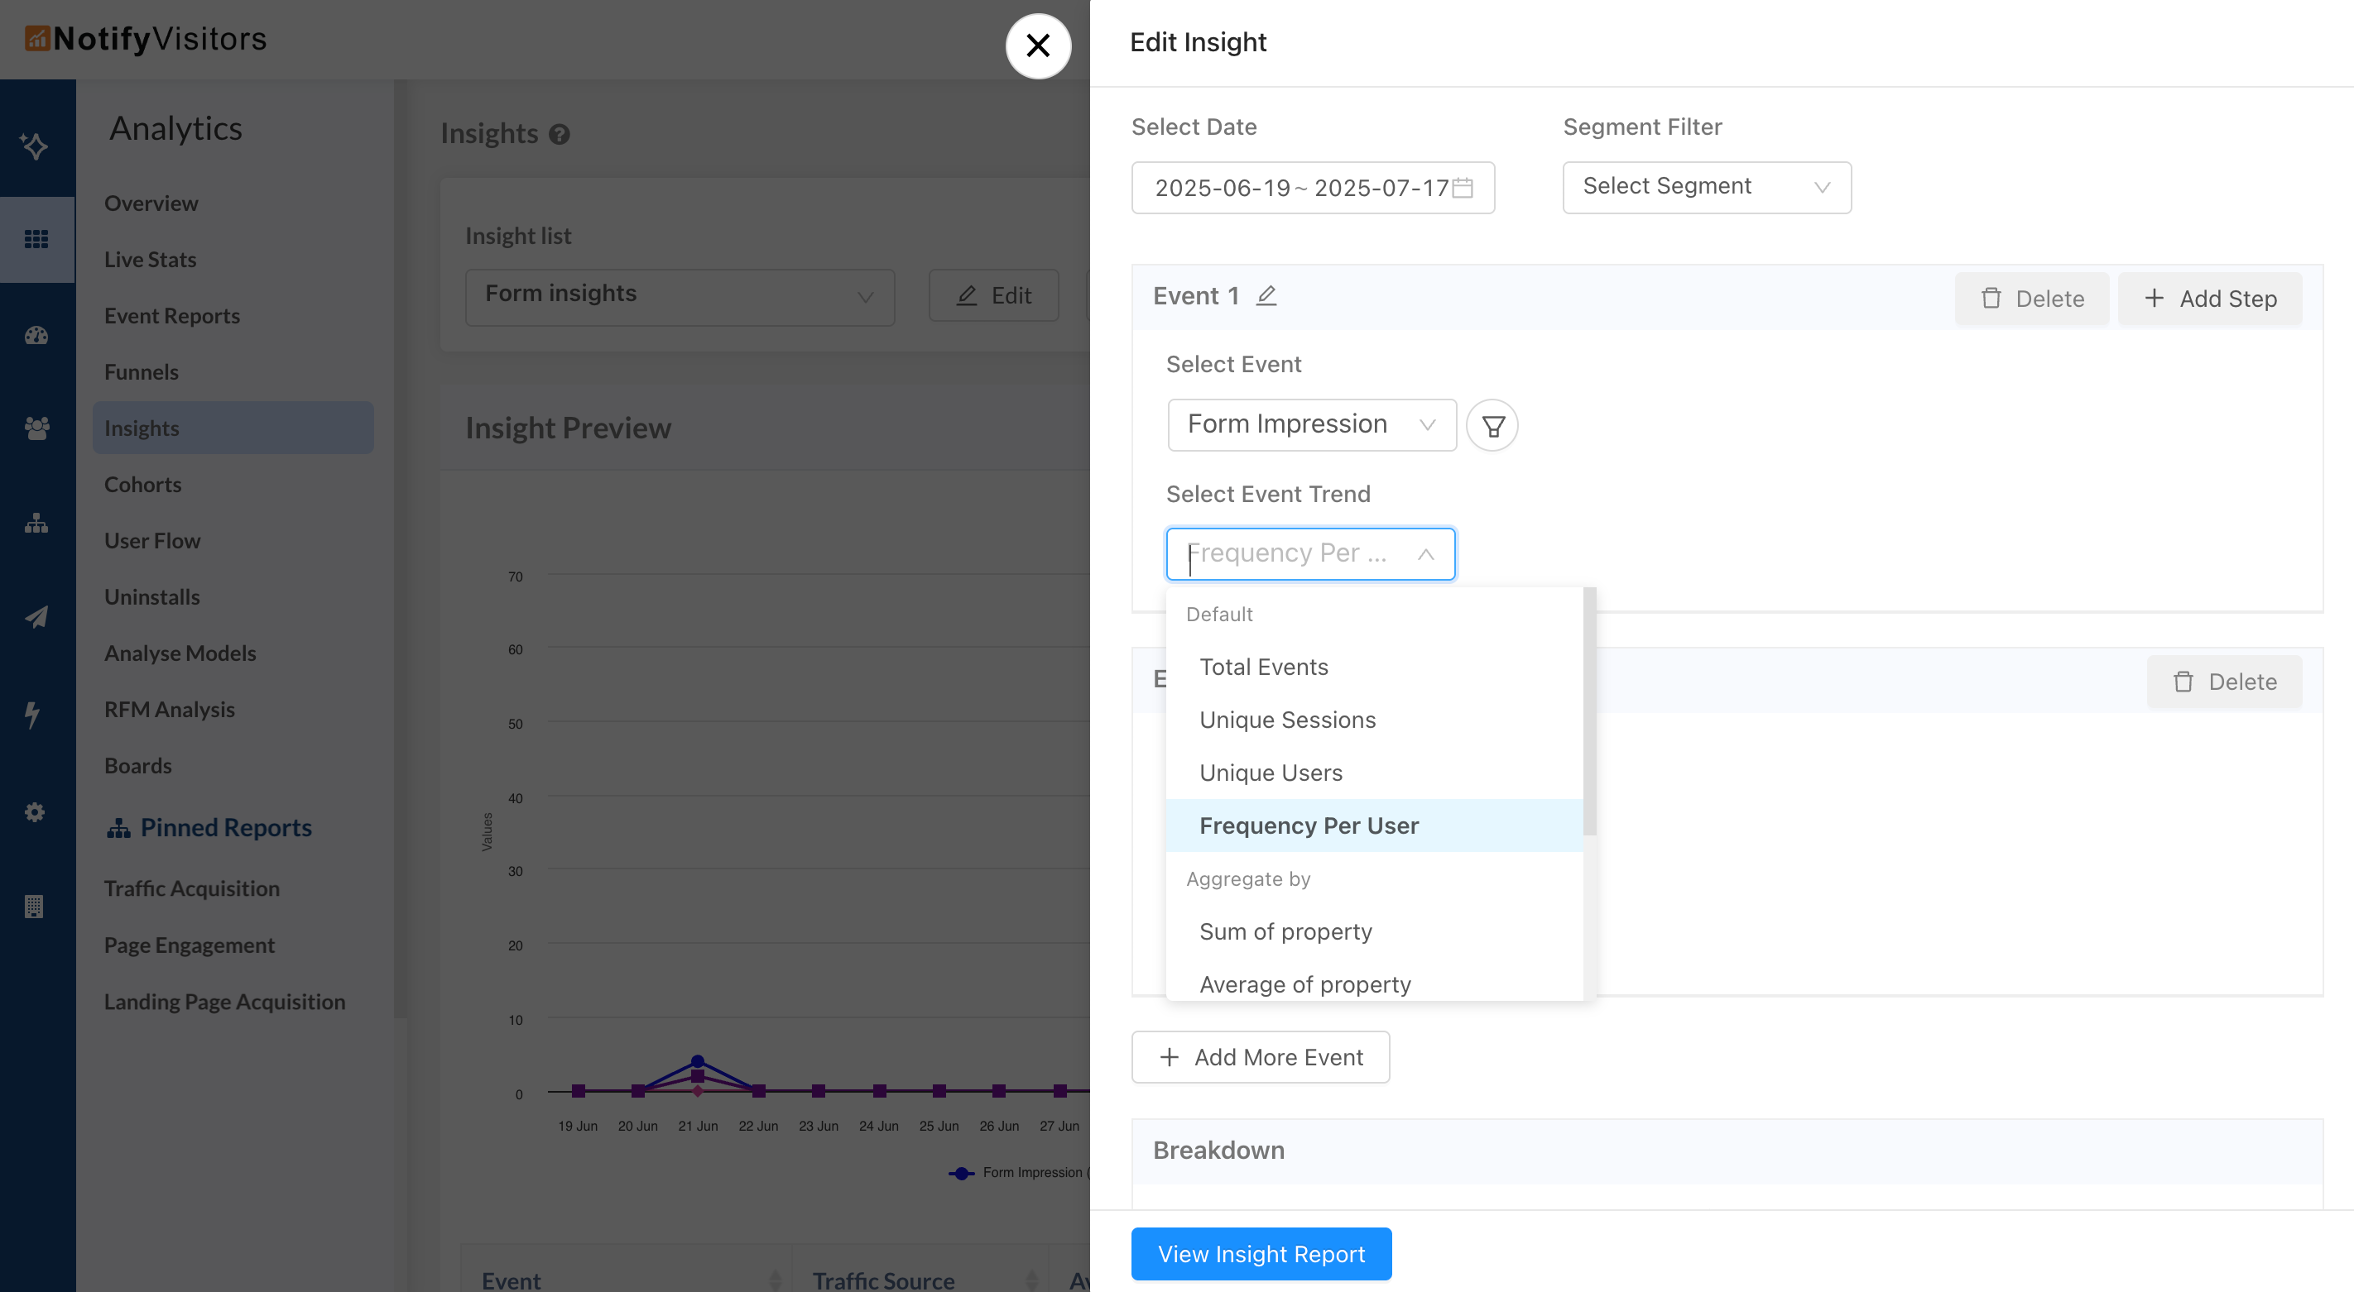
3. Your report will update to display the average event frequency per user for the selected time period.
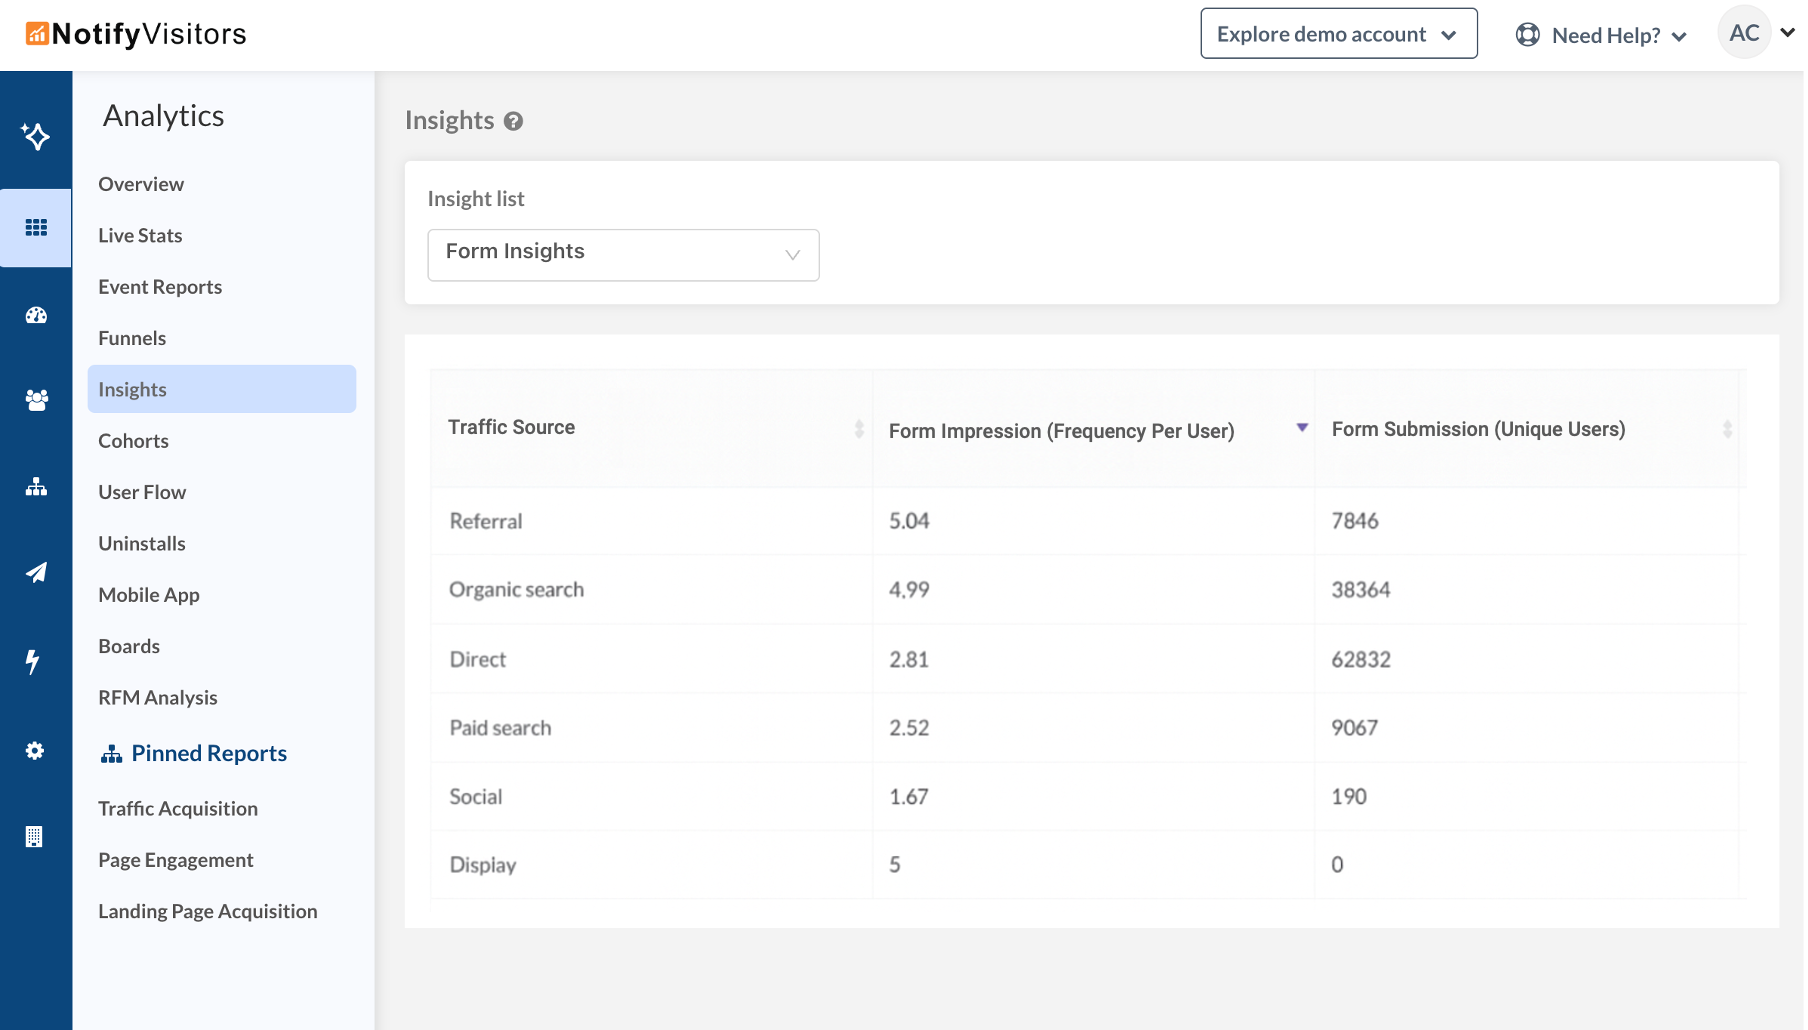
With this, you can easily spot your most engaging actions and identify where user interaction is strongest.

At NotifyVisitors, we are constantly working to bring new features and improvements to our platform, based on the feedback and Read more

Introducing the May Release Notes – a roundup of the top upgrades and enhancements we've made to our platform this Read more

We are excited to announce a range of new features and enhancements in this month's release notes. These updates aim Read more

During this month, several significant updates have been implemented, with a primary focus on enhancing the marketing capabilities of our Read more