
 Email
Email SMS
SMS Whatsapp
 Web Push
 App Push
 Popups
 Channel A/B Testing
  Control groups Analysis
 Frequency Capping
 Funnel Analysis
 Cohort Analysis
 RFM Analysis
 Signup Forms
 Surveys
 NPS
NPS Landing pages personalization
  Website A/B Testing
  PWA/TWA
 Heatmaps
 Session Recording
 Wix
Wix Shopify
 Magento
 Woocommerce
 eCommerce D2C
  Mutual Funds
 Insurance
 Lending
  Recipes
  Product Updates
 App Marketplace
 Academy
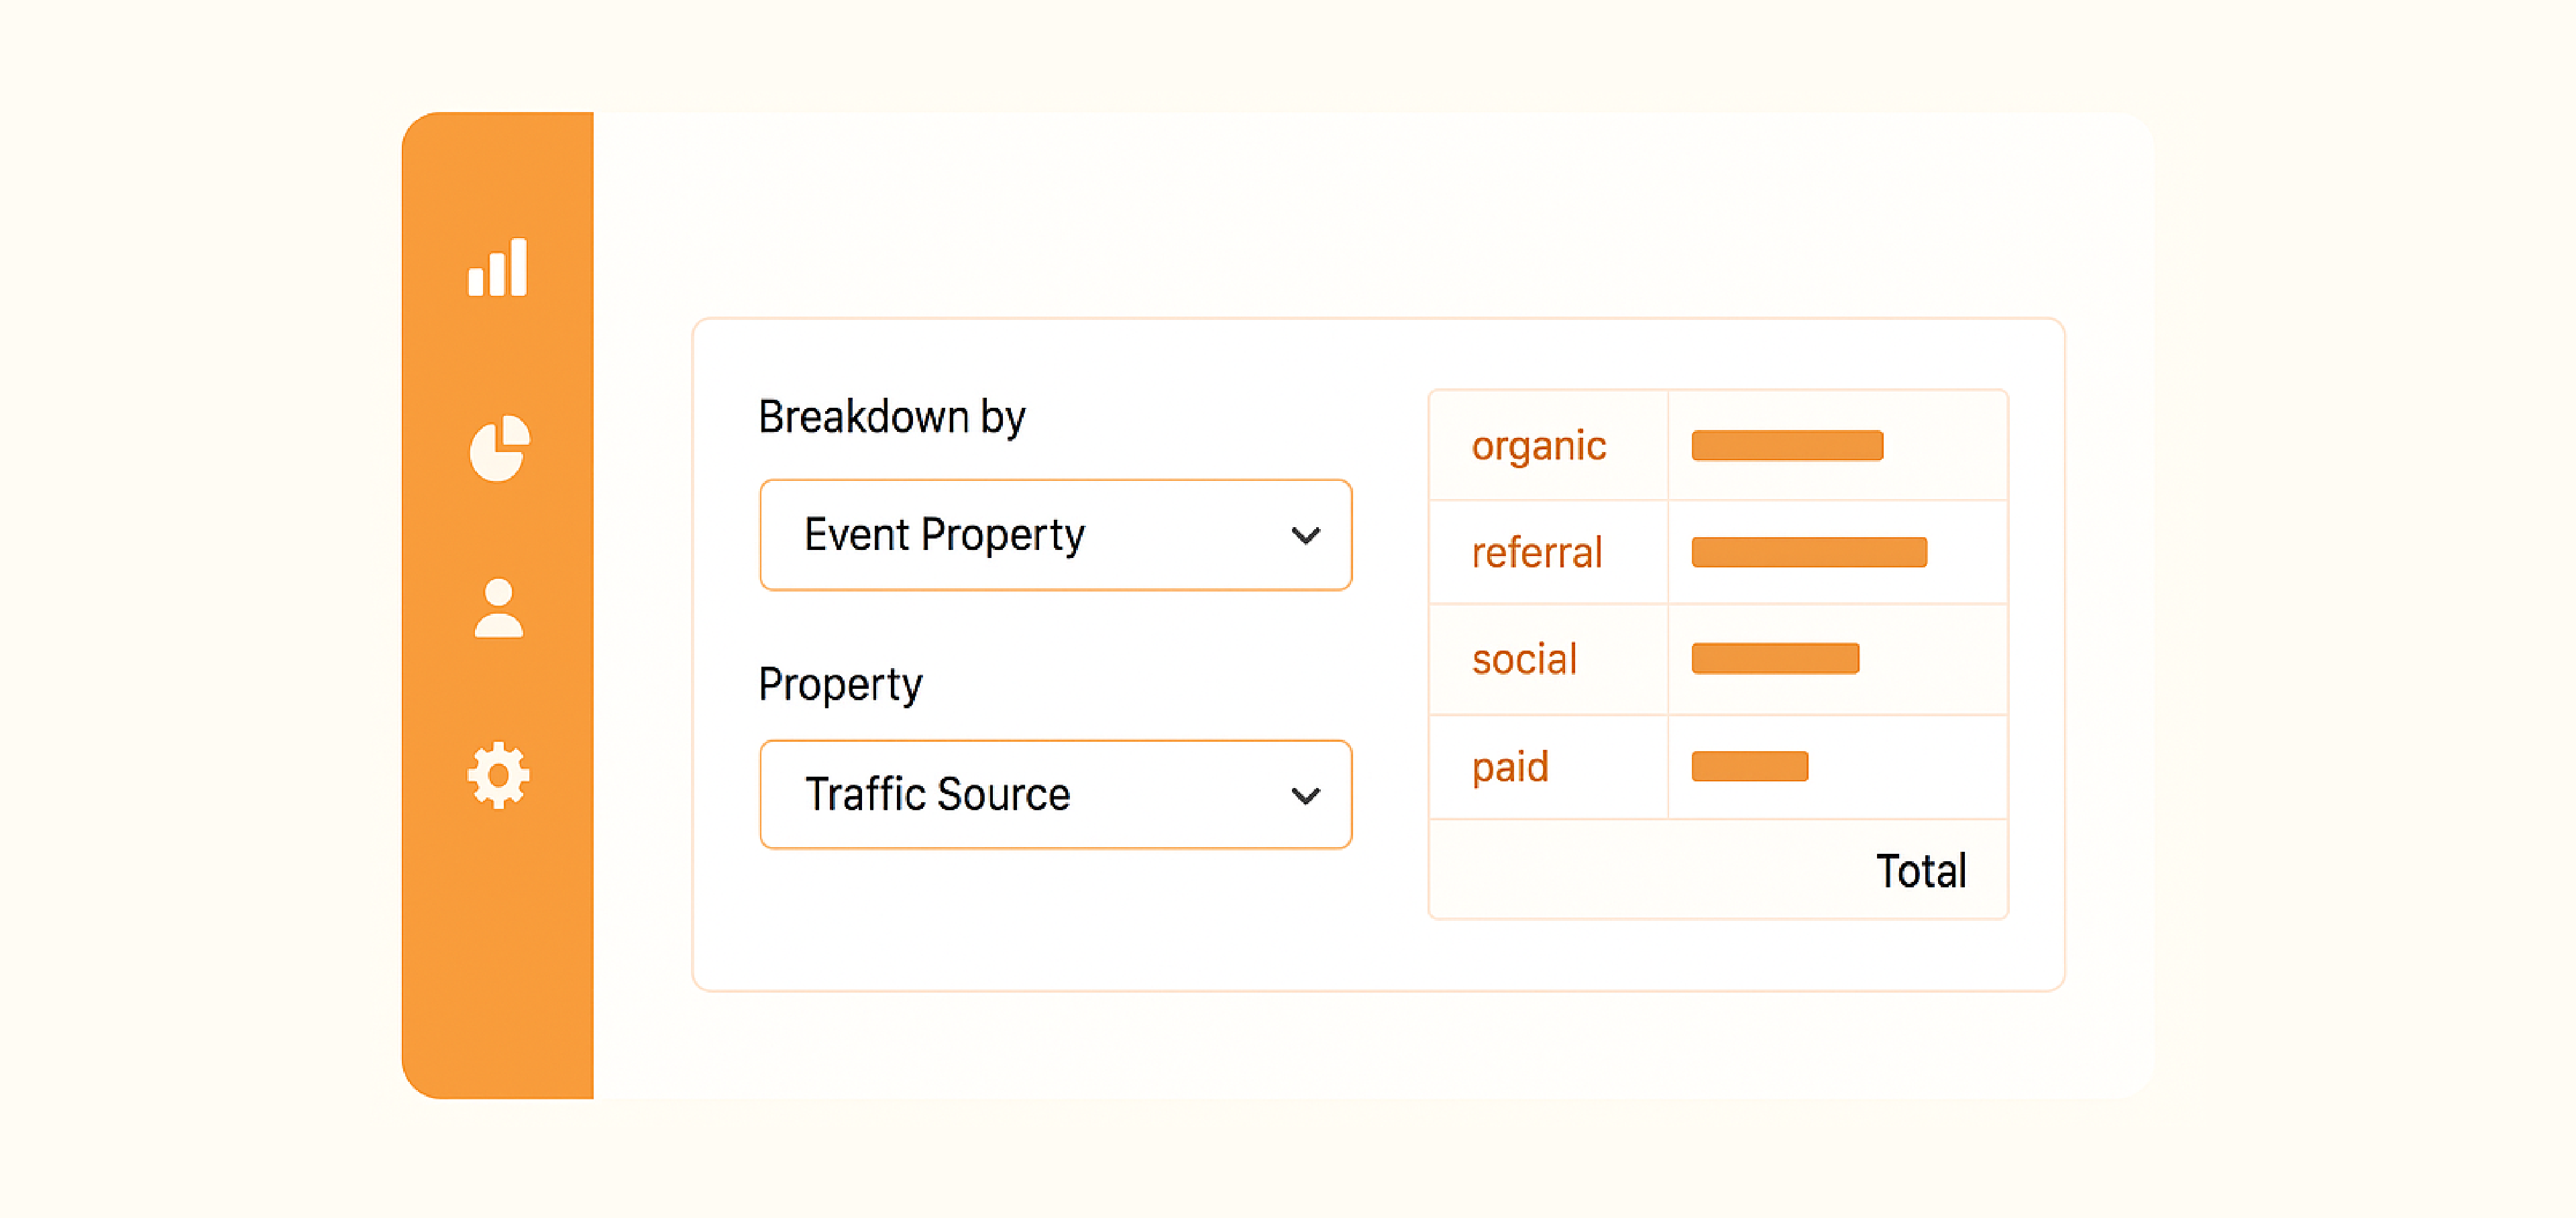
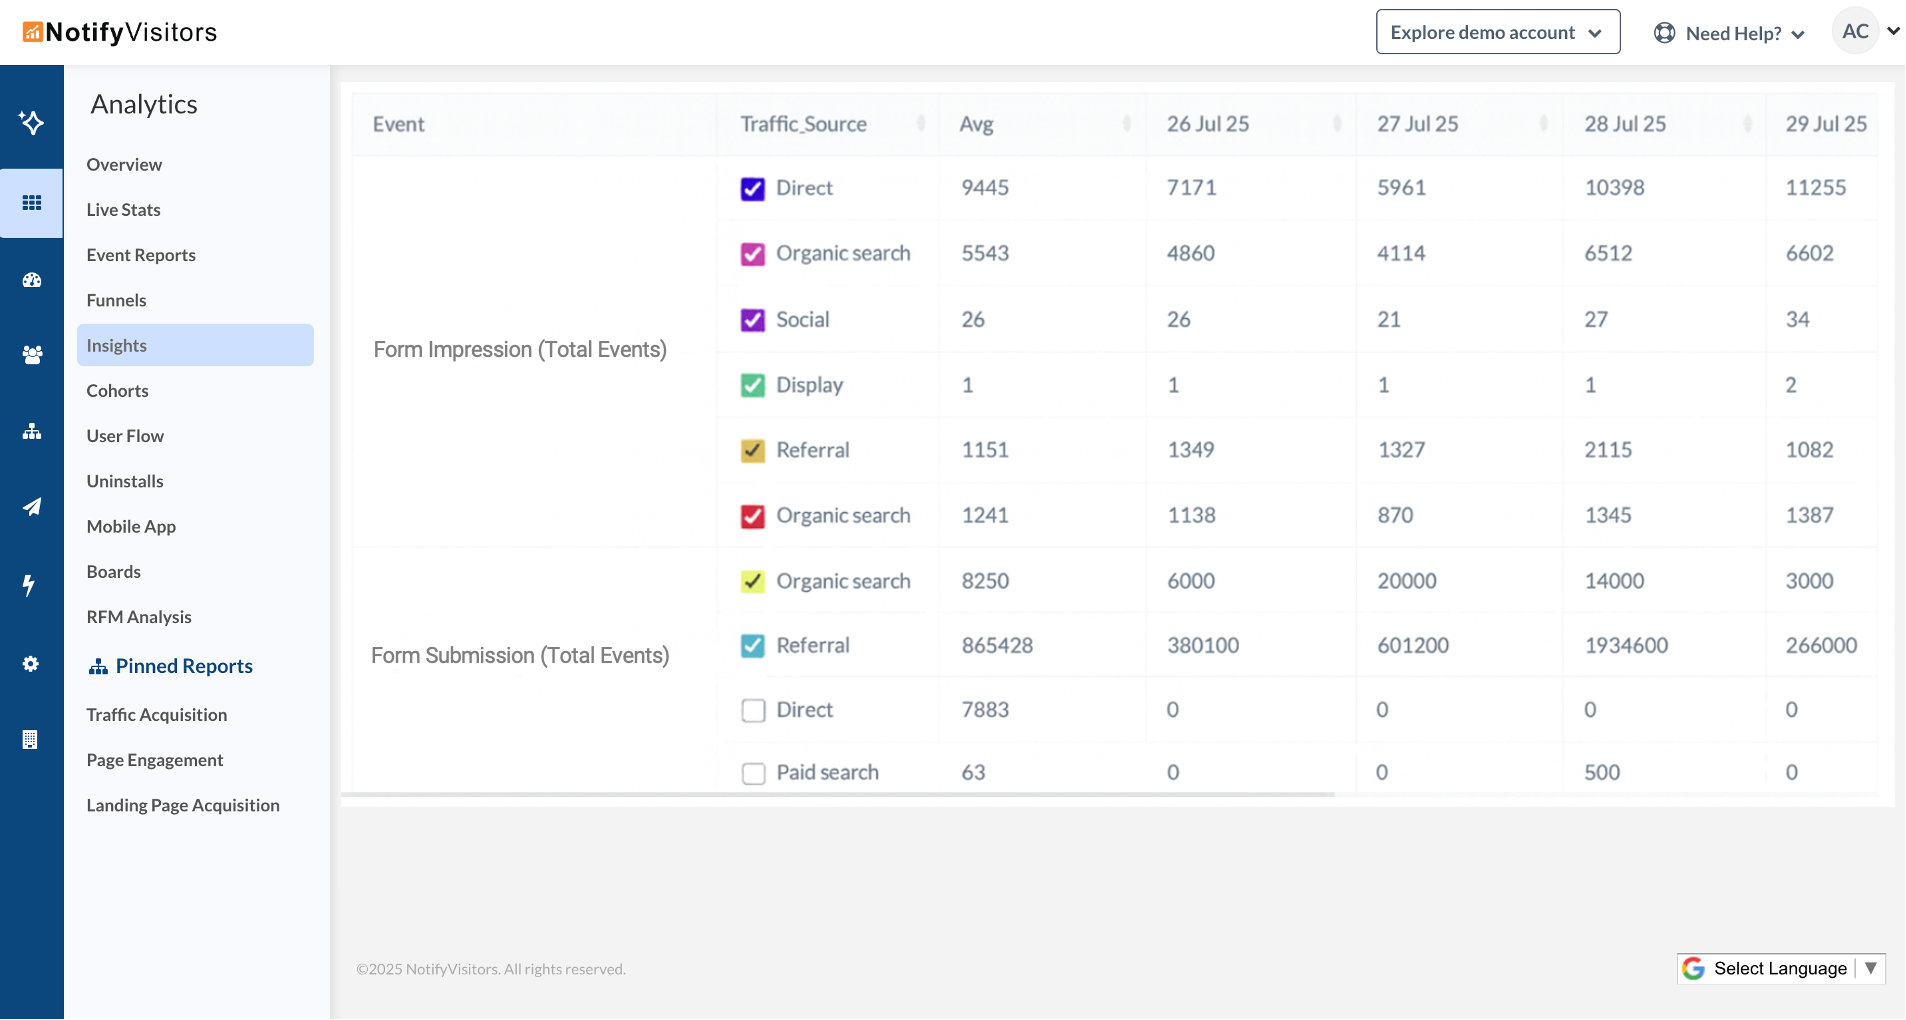
We’ve added a Breakdown by filter to Insights analysis, giving you deeper visibility into your data.
How it works:
- When creating an Insights report with one or more events, you can now apply a Breakdown by filter.
- From the dropdown, choose whether to break down your data by Event Property or User Property.
- Then, select the specific property you want to analyze (e.g., Traffic Source).
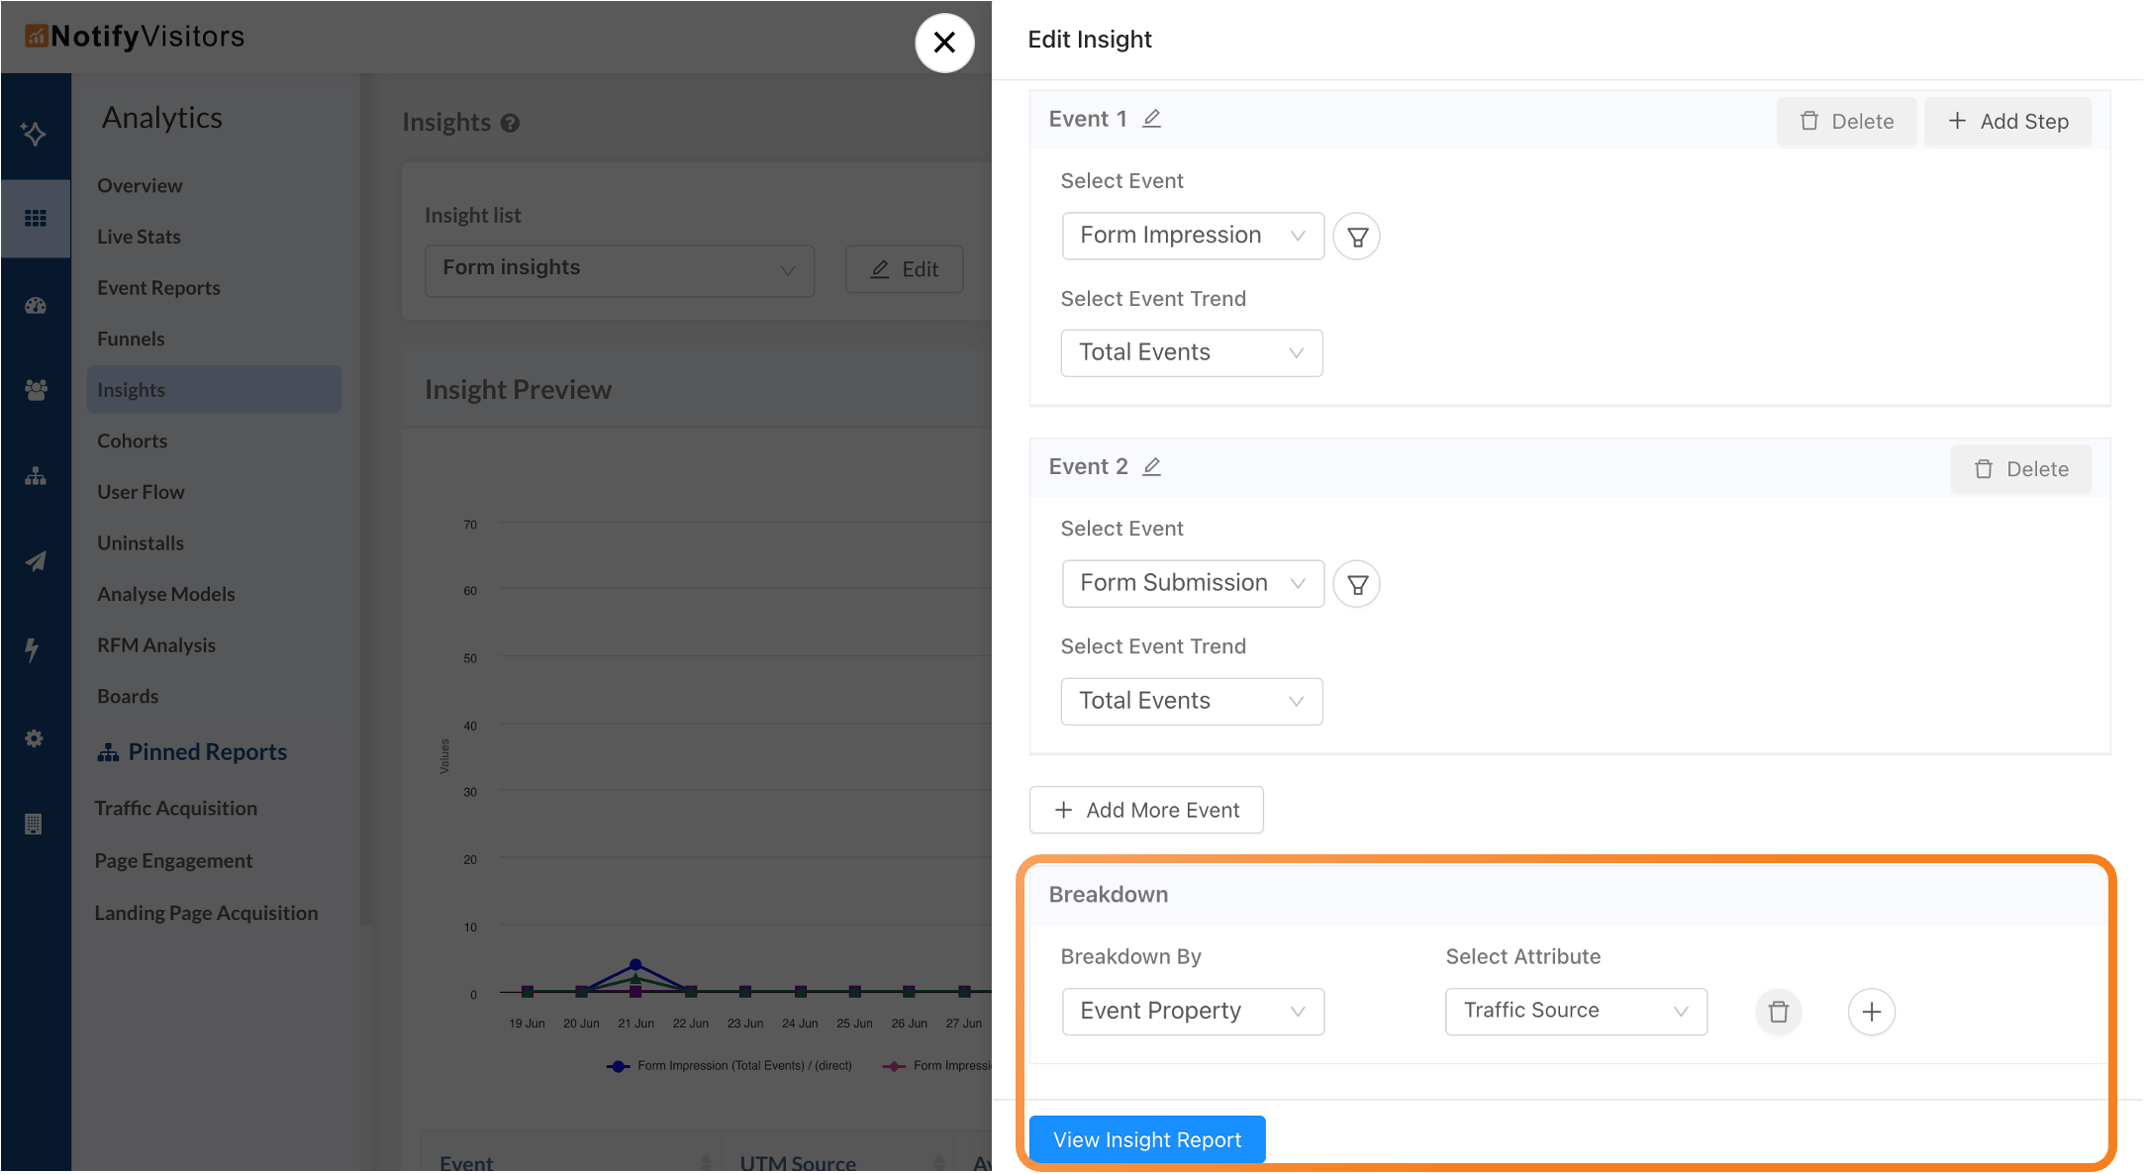
Once applied, your trends and tables will automatically display segmented results, allowing you to compare performance across categories — such as traffic sources, device types, or user segments — at a glance.
Example:
If you’re tracking Form Impression and Form Submission events, you could break them down by Traffic Source to see which channels drive the most form views and conversions.
You can add multiple breakdown filters as well.

At NotifyVisitors, we are constantly working to bring new features and improvements to our platform, based on the feedback and Read more

Introducing the May Release Notes – a roundup of the top upgrades and enhancements we've made to our platform this Read more

We are excited to announce a range of new features and enhancements in this month's release notes. These updates aim Read more

During this month, several significant updates have been implemented, with a primary focus on enhancing the marketing capabilities of our Read more