
 Email
Email SMS
SMS Whatsapp
 Web Push
 App Push
 Popups
 Channel A/B Testing
  Control groups Analysis
 Frequency Capping
 Funnel Analysis
 Cohort Analysis
 RFM Analysis
 Signup Forms
 Surveys
 NPS
NPS Landing pages personalization
  Website A/B Testing
  PWA/TWA
 Heatmaps
 Session Recording
 Wix
Wix Shopify
 Magento
 Woocommerce
 eCommerce D2C
  Mutual Funds
 Insurance
 Lending
  Recipes
  Product Updates
 App Marketplace
 Academy
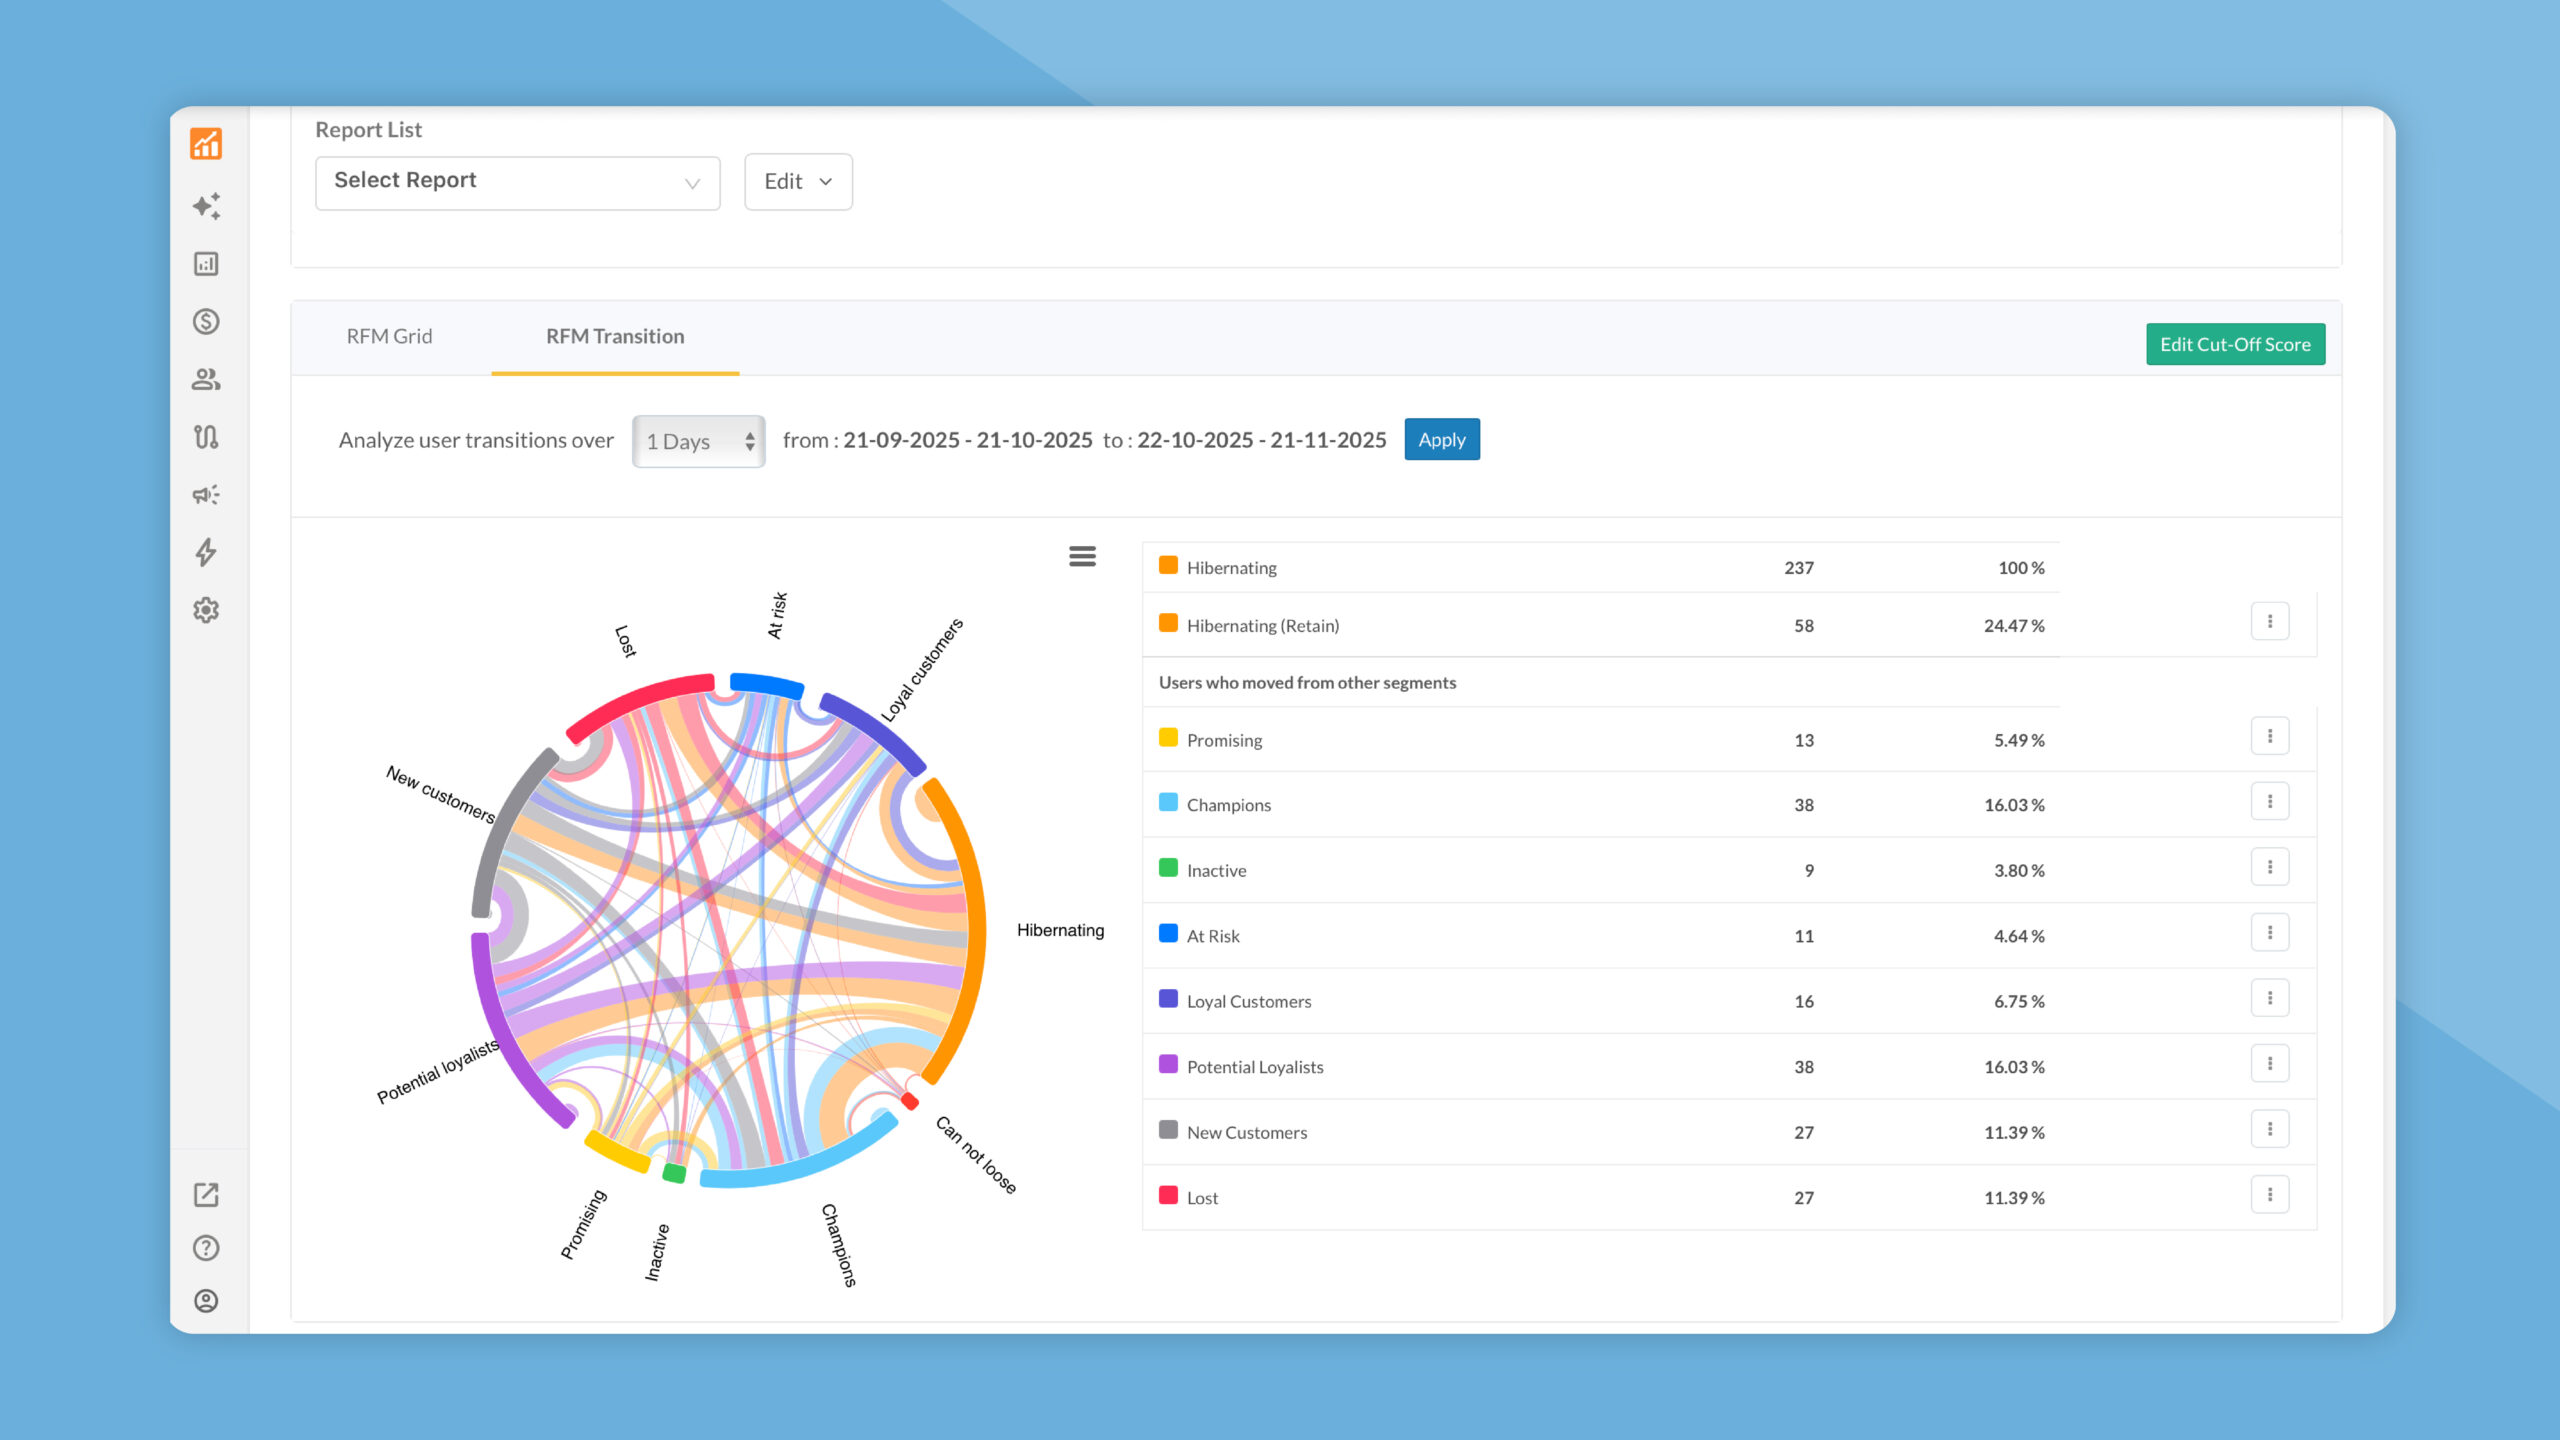
We’ve introduced significant enhancements to our RFM features. If you’re new to RFM, here’s a quick refresher: RFM group customers by Recency, Frequency, and Monetary value to reveal who’s most/least valuable and how to target them best. Kindly go through our RFM Analysis guide and the RFM Segments overview to get familiar with the fundamentals.
Let’s dive into the updates:
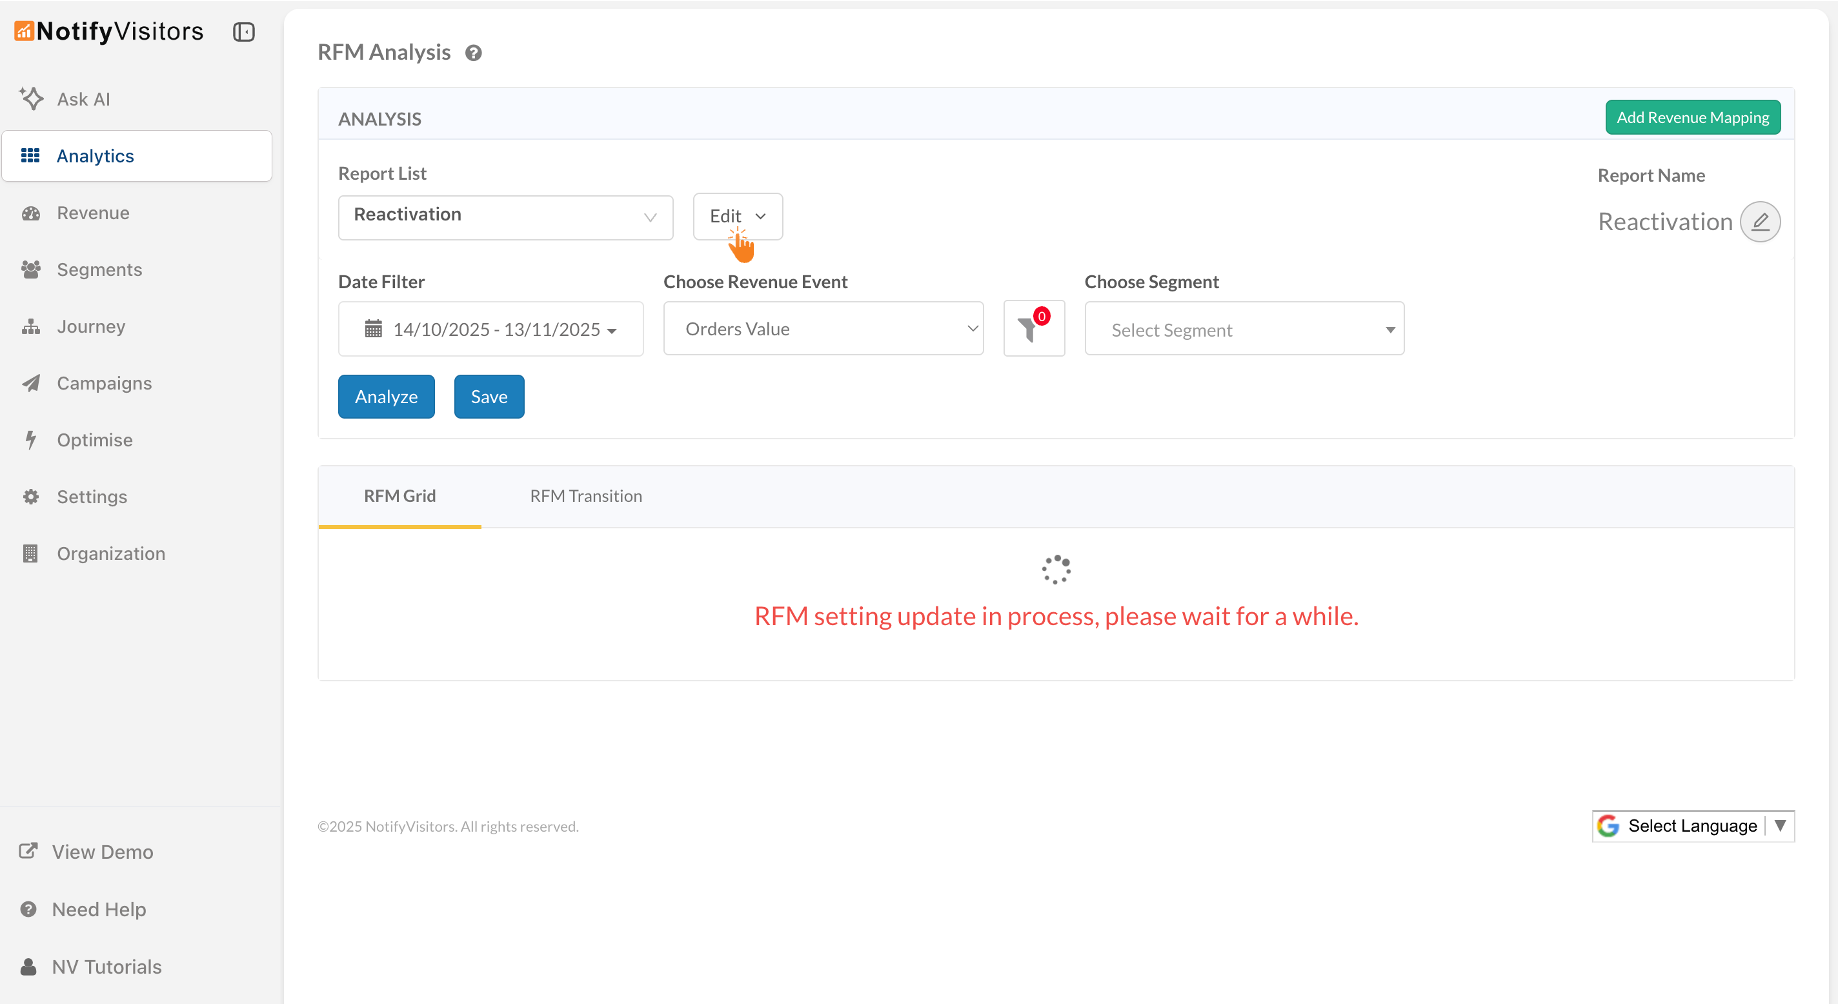
1. Save & Reuse Your RFM Reports
You can now save your RFM analysis as named reports that live in the Report List dropdown. To access them, go to Analytics → RFM Analysis and open the Report List dropdown.
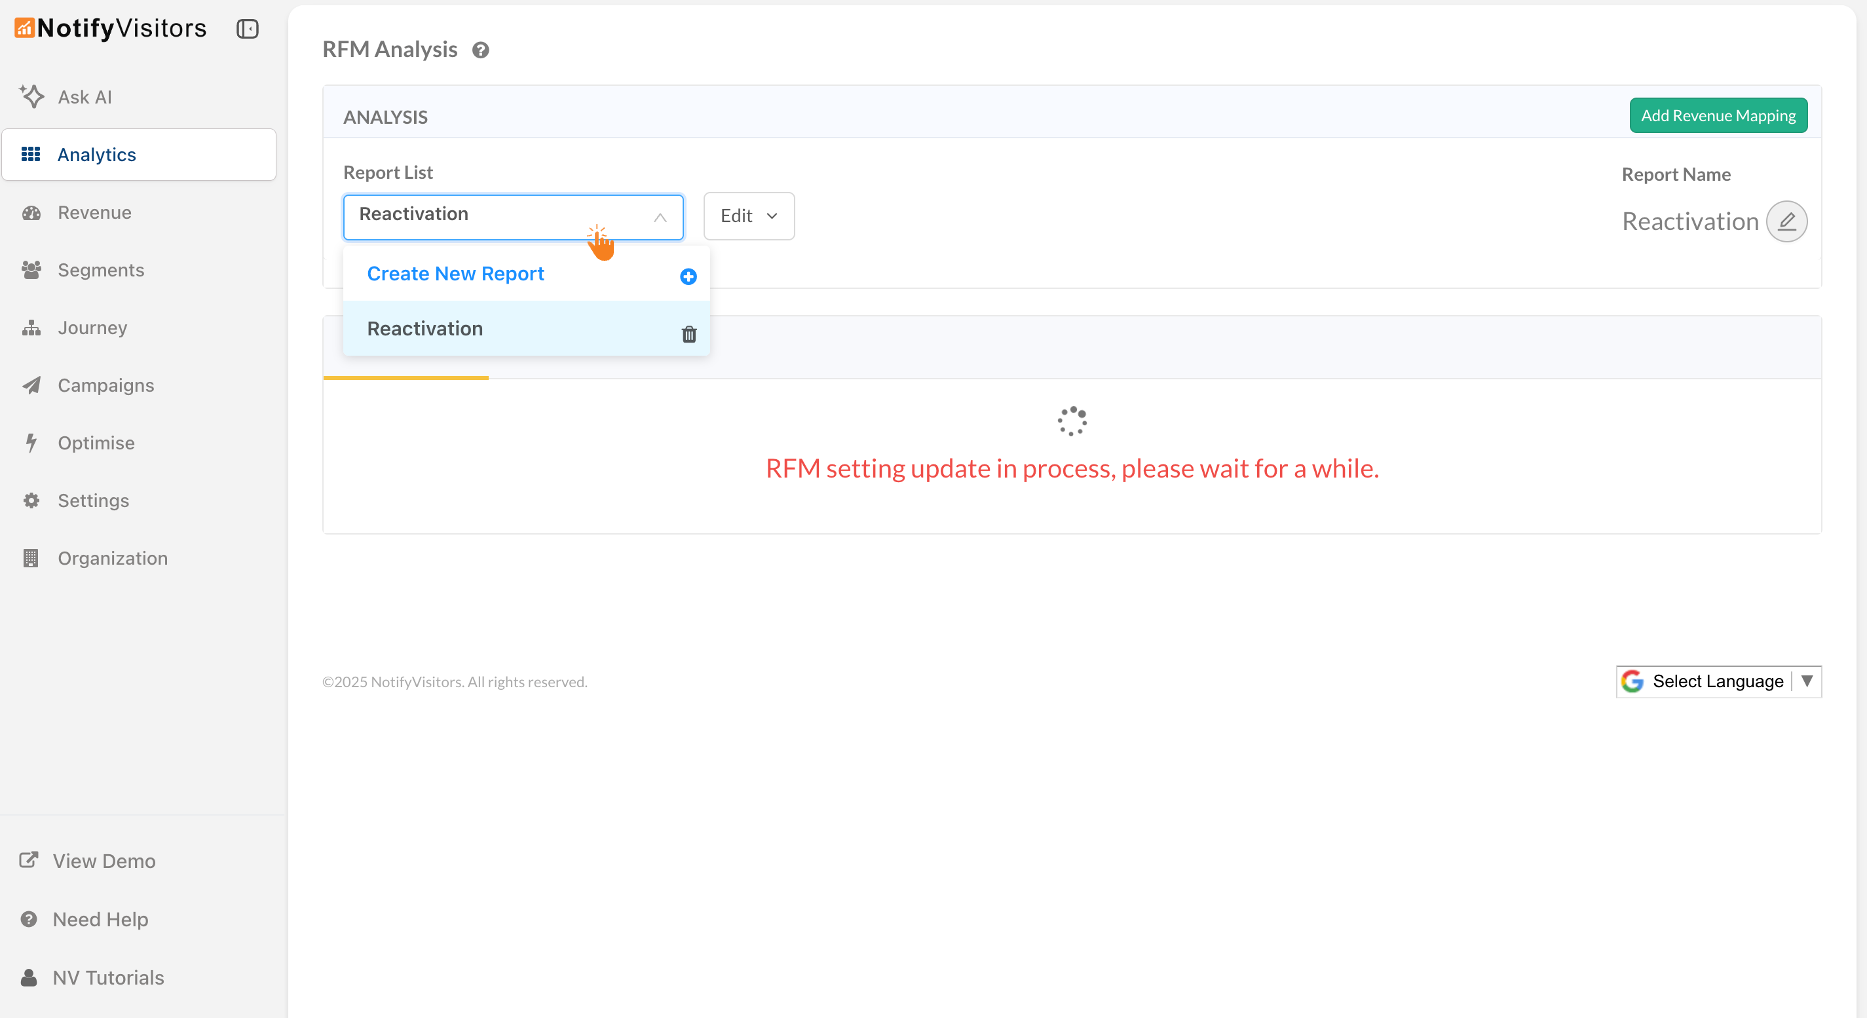
From this dropdown you can Create New Report, pick any existing report, and quickly edit its settings (date range, revenue event/attribute, and segment filters). This makes it effortless to revisit a favorite RFM setup or iterate without rebuilding it each time.
Why it’s useful
- Speed & consistency: Reopen the exact RFM configuration you or your teammates rely on—no rework.
- Smarter iteration: Tweak dates, switch the revenue event/attribute, or add/remove a segment in seconds to compare results.
- Collaboration-ready: Shared report names make it easy for teams to align on the same RFM view.
Save once, reuse forever—this update makes your RFM workflow faster, consistent, and collaboration-friendly.
2. Manually set RFM cut-off scores (Static mode)
Analysts who already know the exact recency (days), frequency, and monetary thresholds that define their business can now override the system’s auto-calculated RFM ranges. This gives you tighter control over how users fall into segments (e.g., Champions, Loyal, At Risk), ensuring the grid reflects your internal definitions.
How it works
- To access, click the Edit Cut-off score button (top-right).
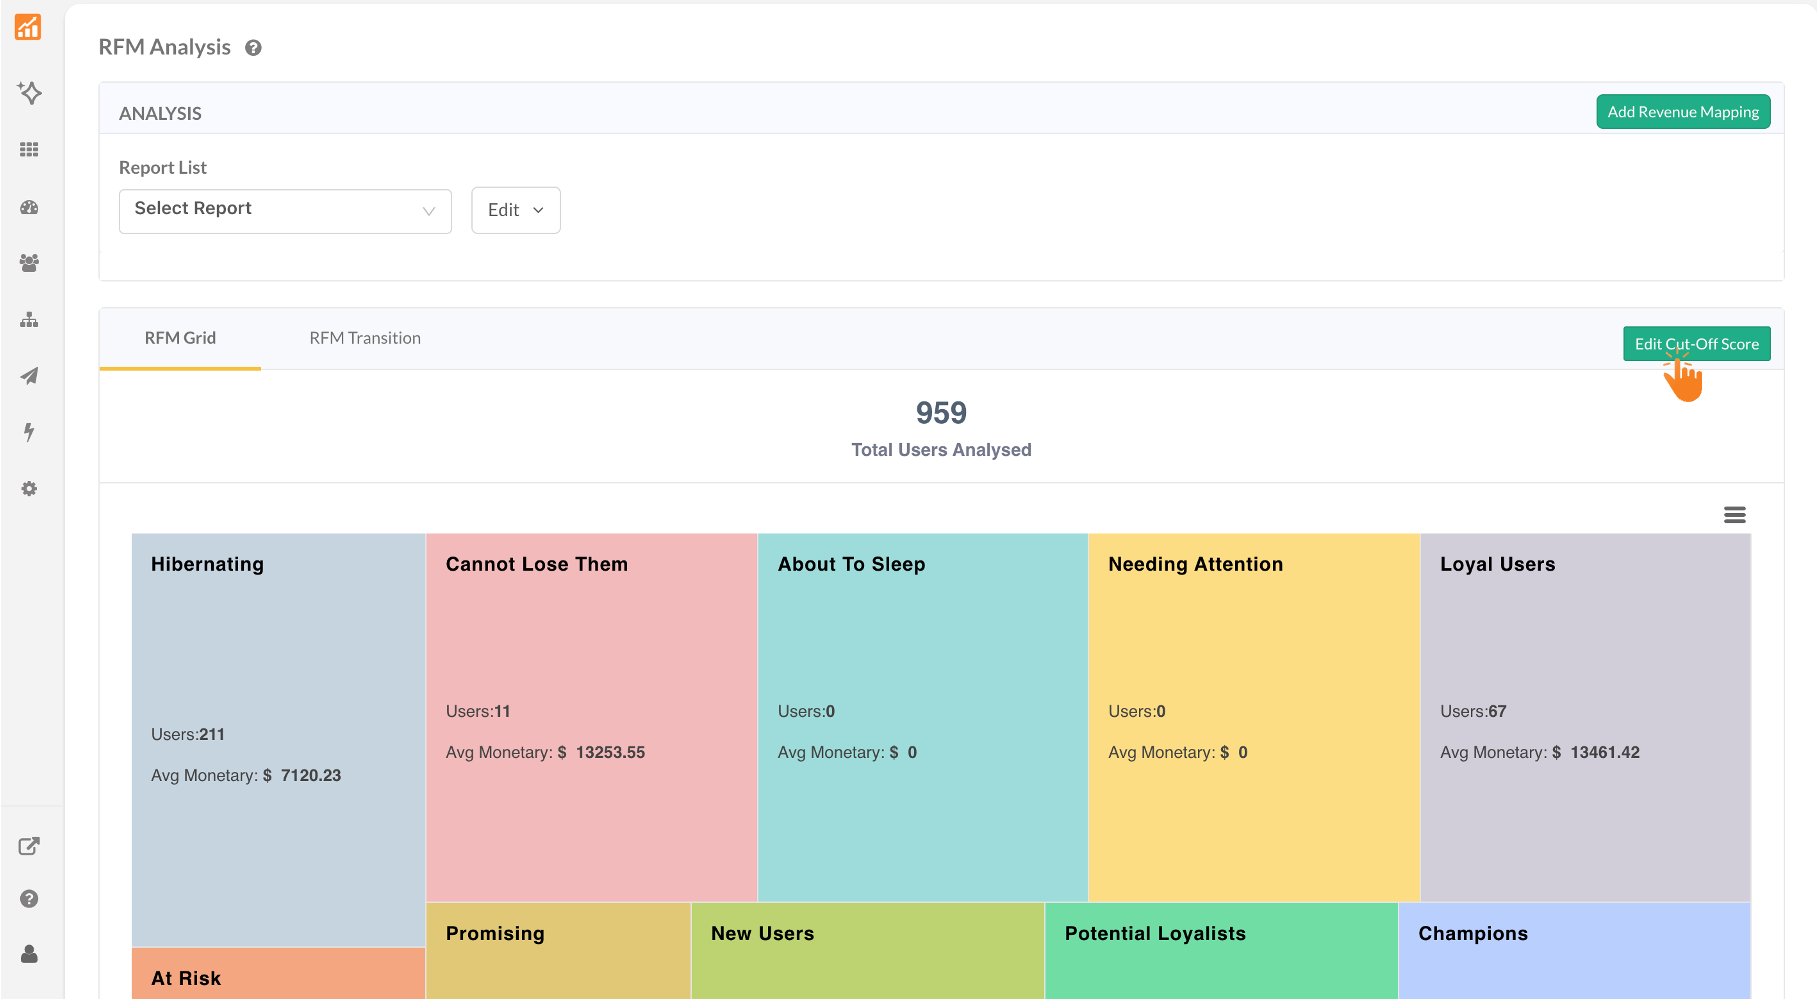
- Choose Static to enable manual entry.
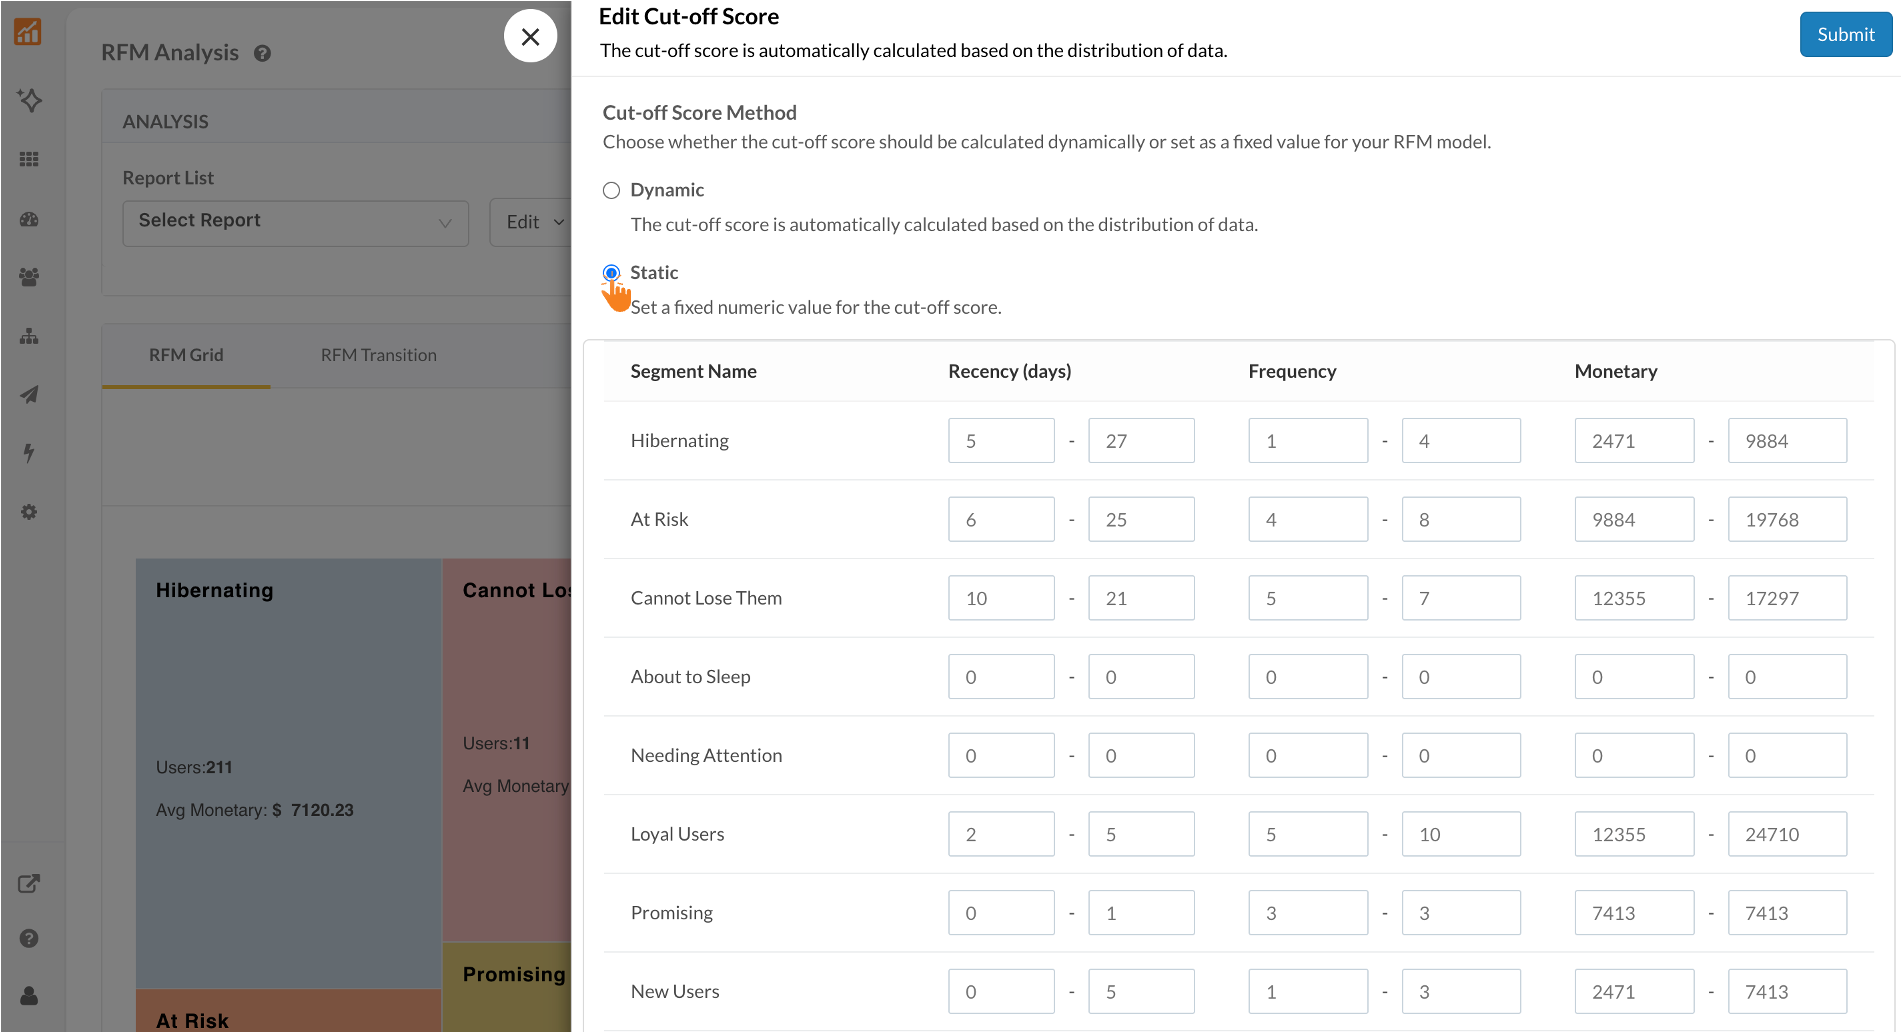
- For each segment row (e.g., Hibernating, At Risk, Cannot Lose Them, About to Sleep, Needing Attention, Loyal Users, Promising, Champions), enter your custom Recency (days), Frequency, and Monetary ranges.
- Submit to apply. The RFM grid and related segment analytics will now use your thresholds.
- To revert to the platform’s auto-computed model, reopen Edit Cut-off score, select Dynamic, and Submit.
⚠️ Recommended for RFM experts only. Manual cut-offs directly impact segment rules and downstream reporting; if unsure, keep Dynamic on.
Static cut-off scores put advanced RFM control in your hands—switch it on when you need precision, or back to Dynamic when you want our algorithm to do the heavy lifting.
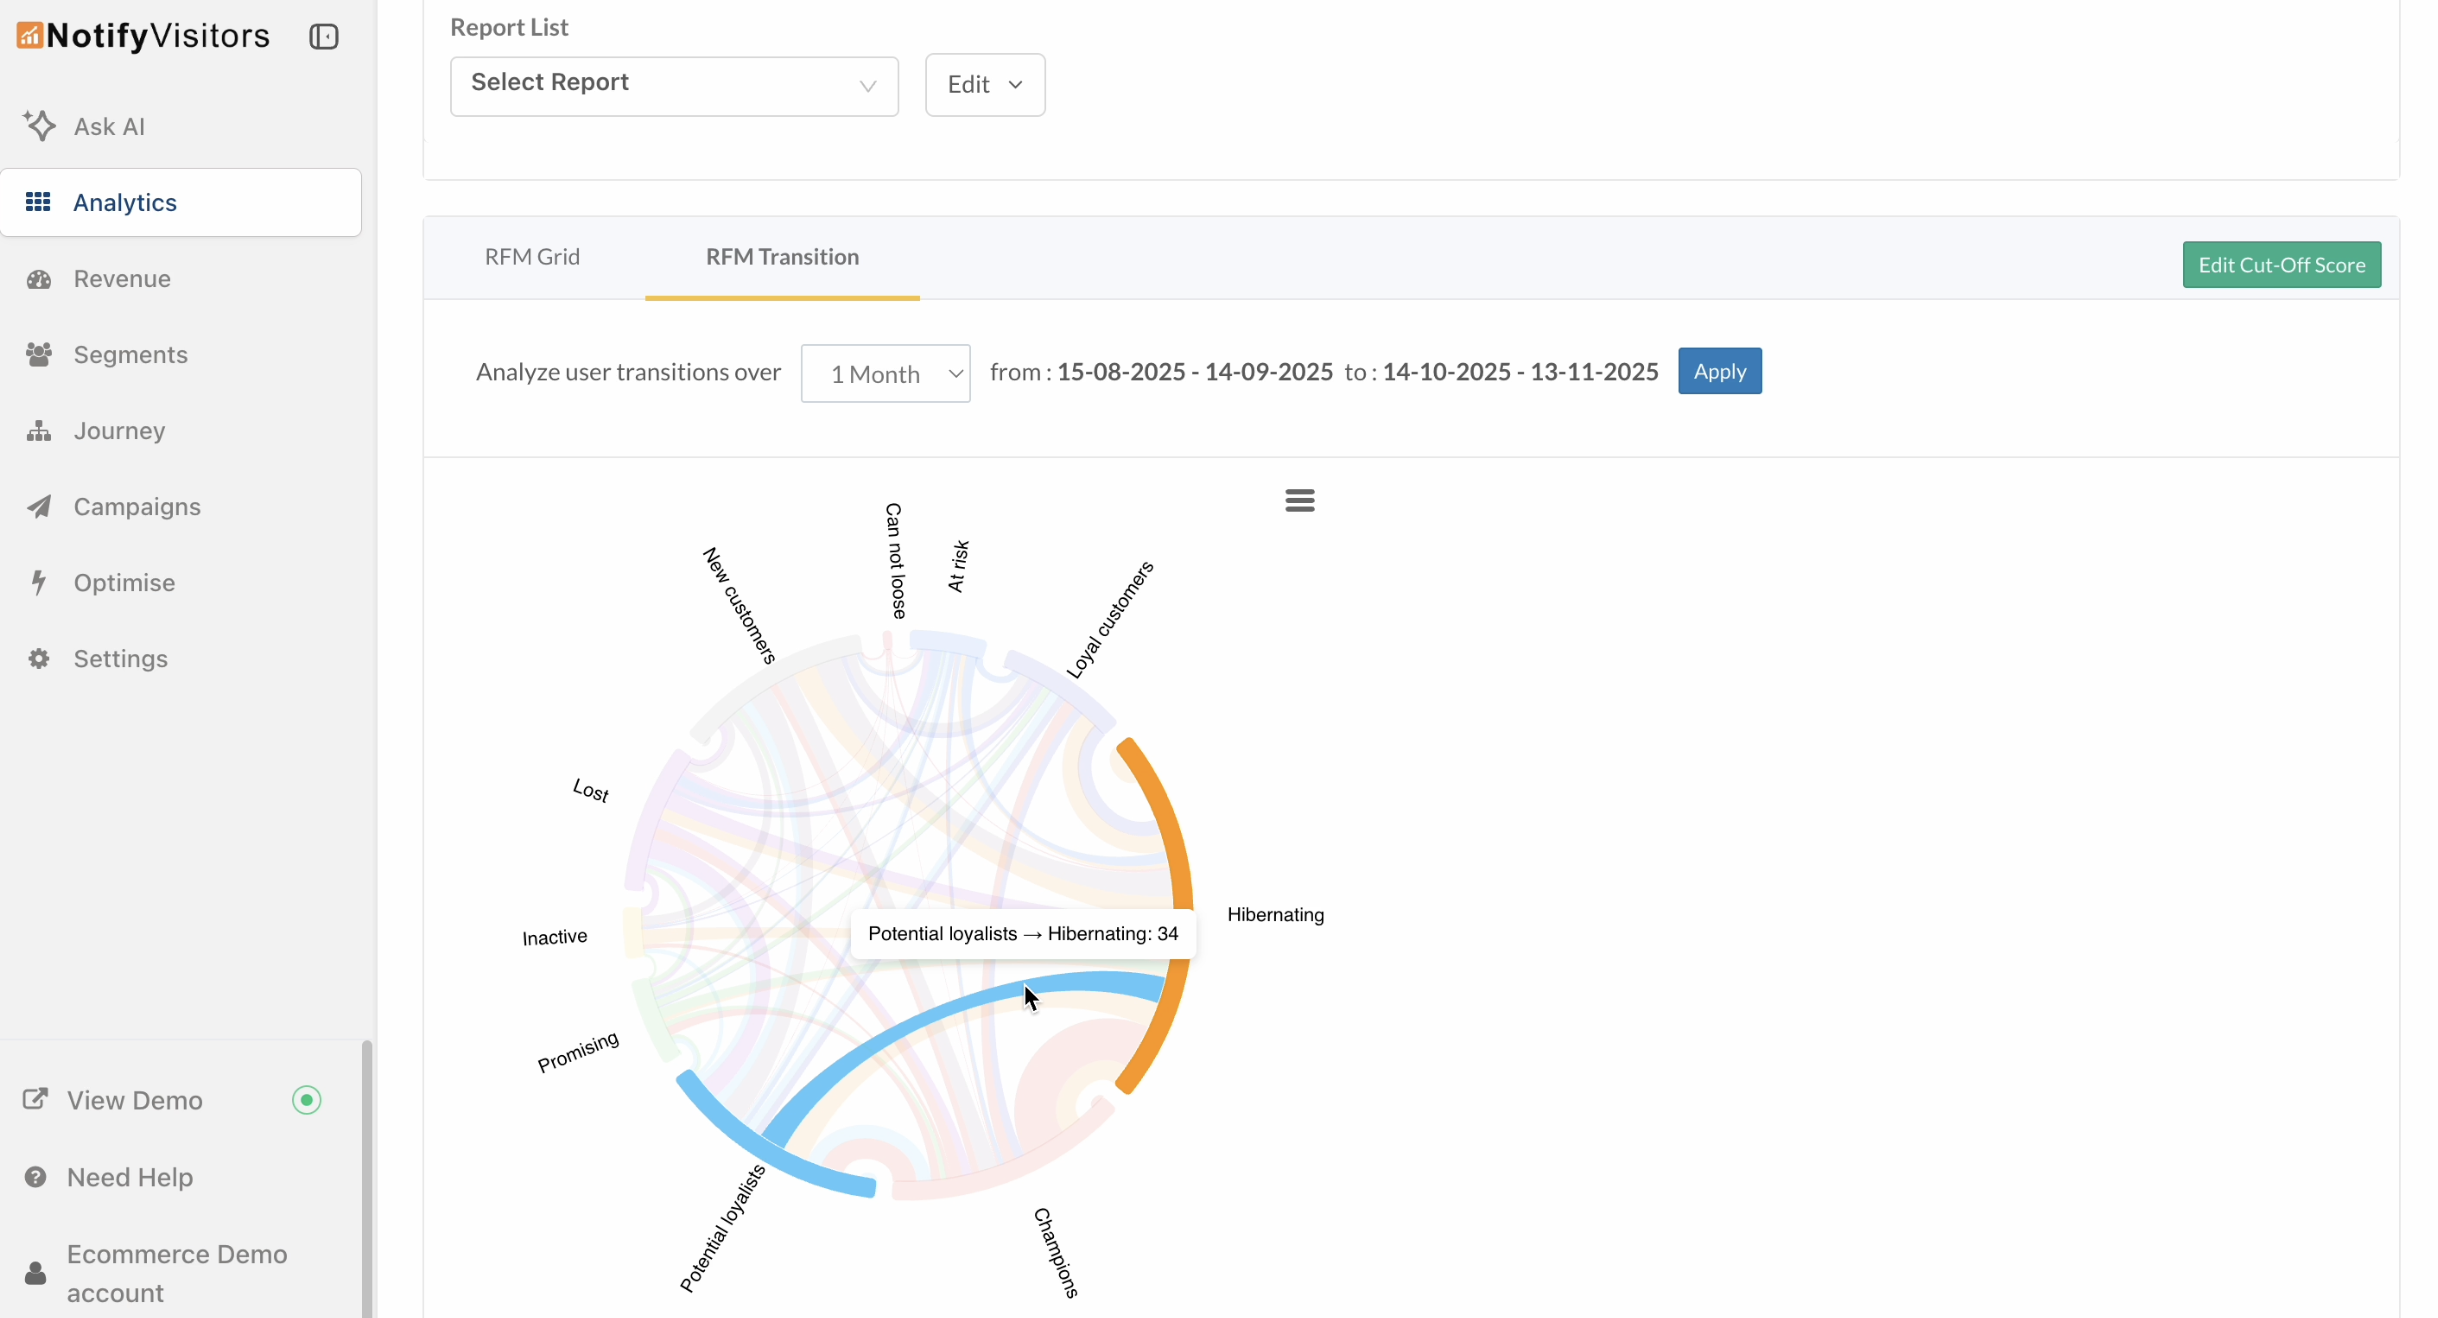
3. RFM Transition — see how users move between segments
RFM Transition shows how your users shift between RFM segments (e.g., Loyal → Champions, At Risk → Lost) across a time window you choose. It turns yesterday’s static segmentation into an action-ready, time-based view so you can double-down on what’s working and rescue users before they churn.
What’s new & how it helps
Problem: Static RFM snapshots don’t tell you who changed since last time—making it hard to spot risk, celebrate upgrades, or measure impact of campaigns.
Solution: RFM Transition compares two RFM windows and visualizes the flows of users between segments, plus a table view with exact counts and percentages for quick action.
How to use it
- In RFM Analysis, open the RFM Transition tab.
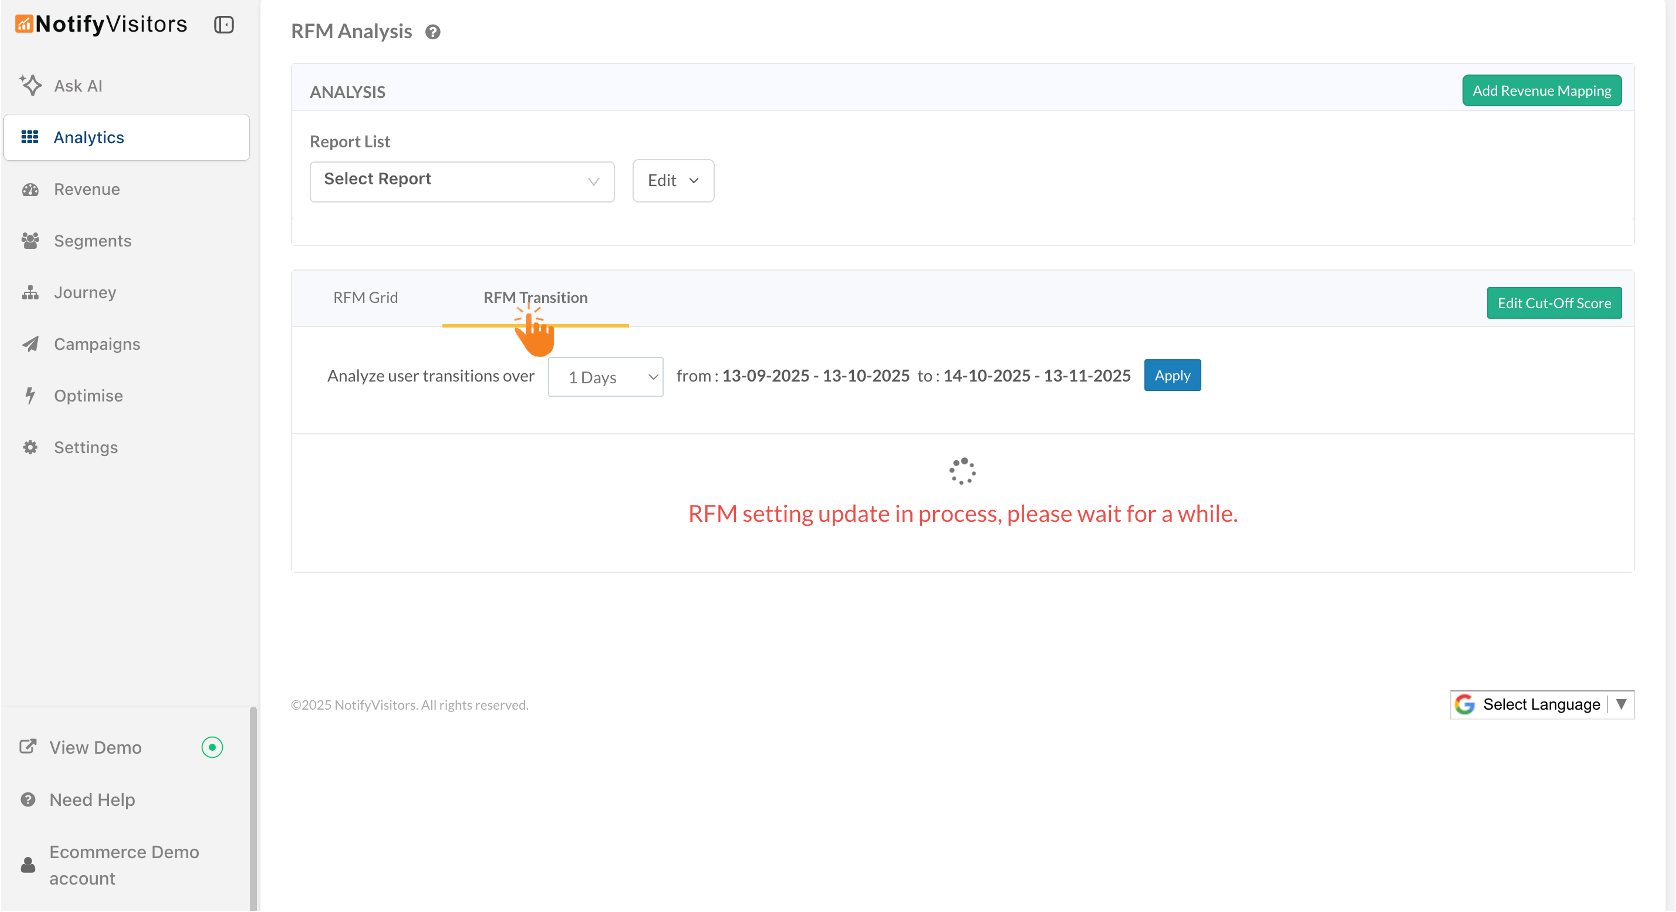
- Choose Analyze user transitions over → select a period (e.g., 1 month).
Example: If your RFM segment duration is 3 months (May–July) and you pick 1 month, the system skips one month (April) and compares Jan–Mar to May–July, showing how many users moved between segments in that window.
- Review the chord graph:
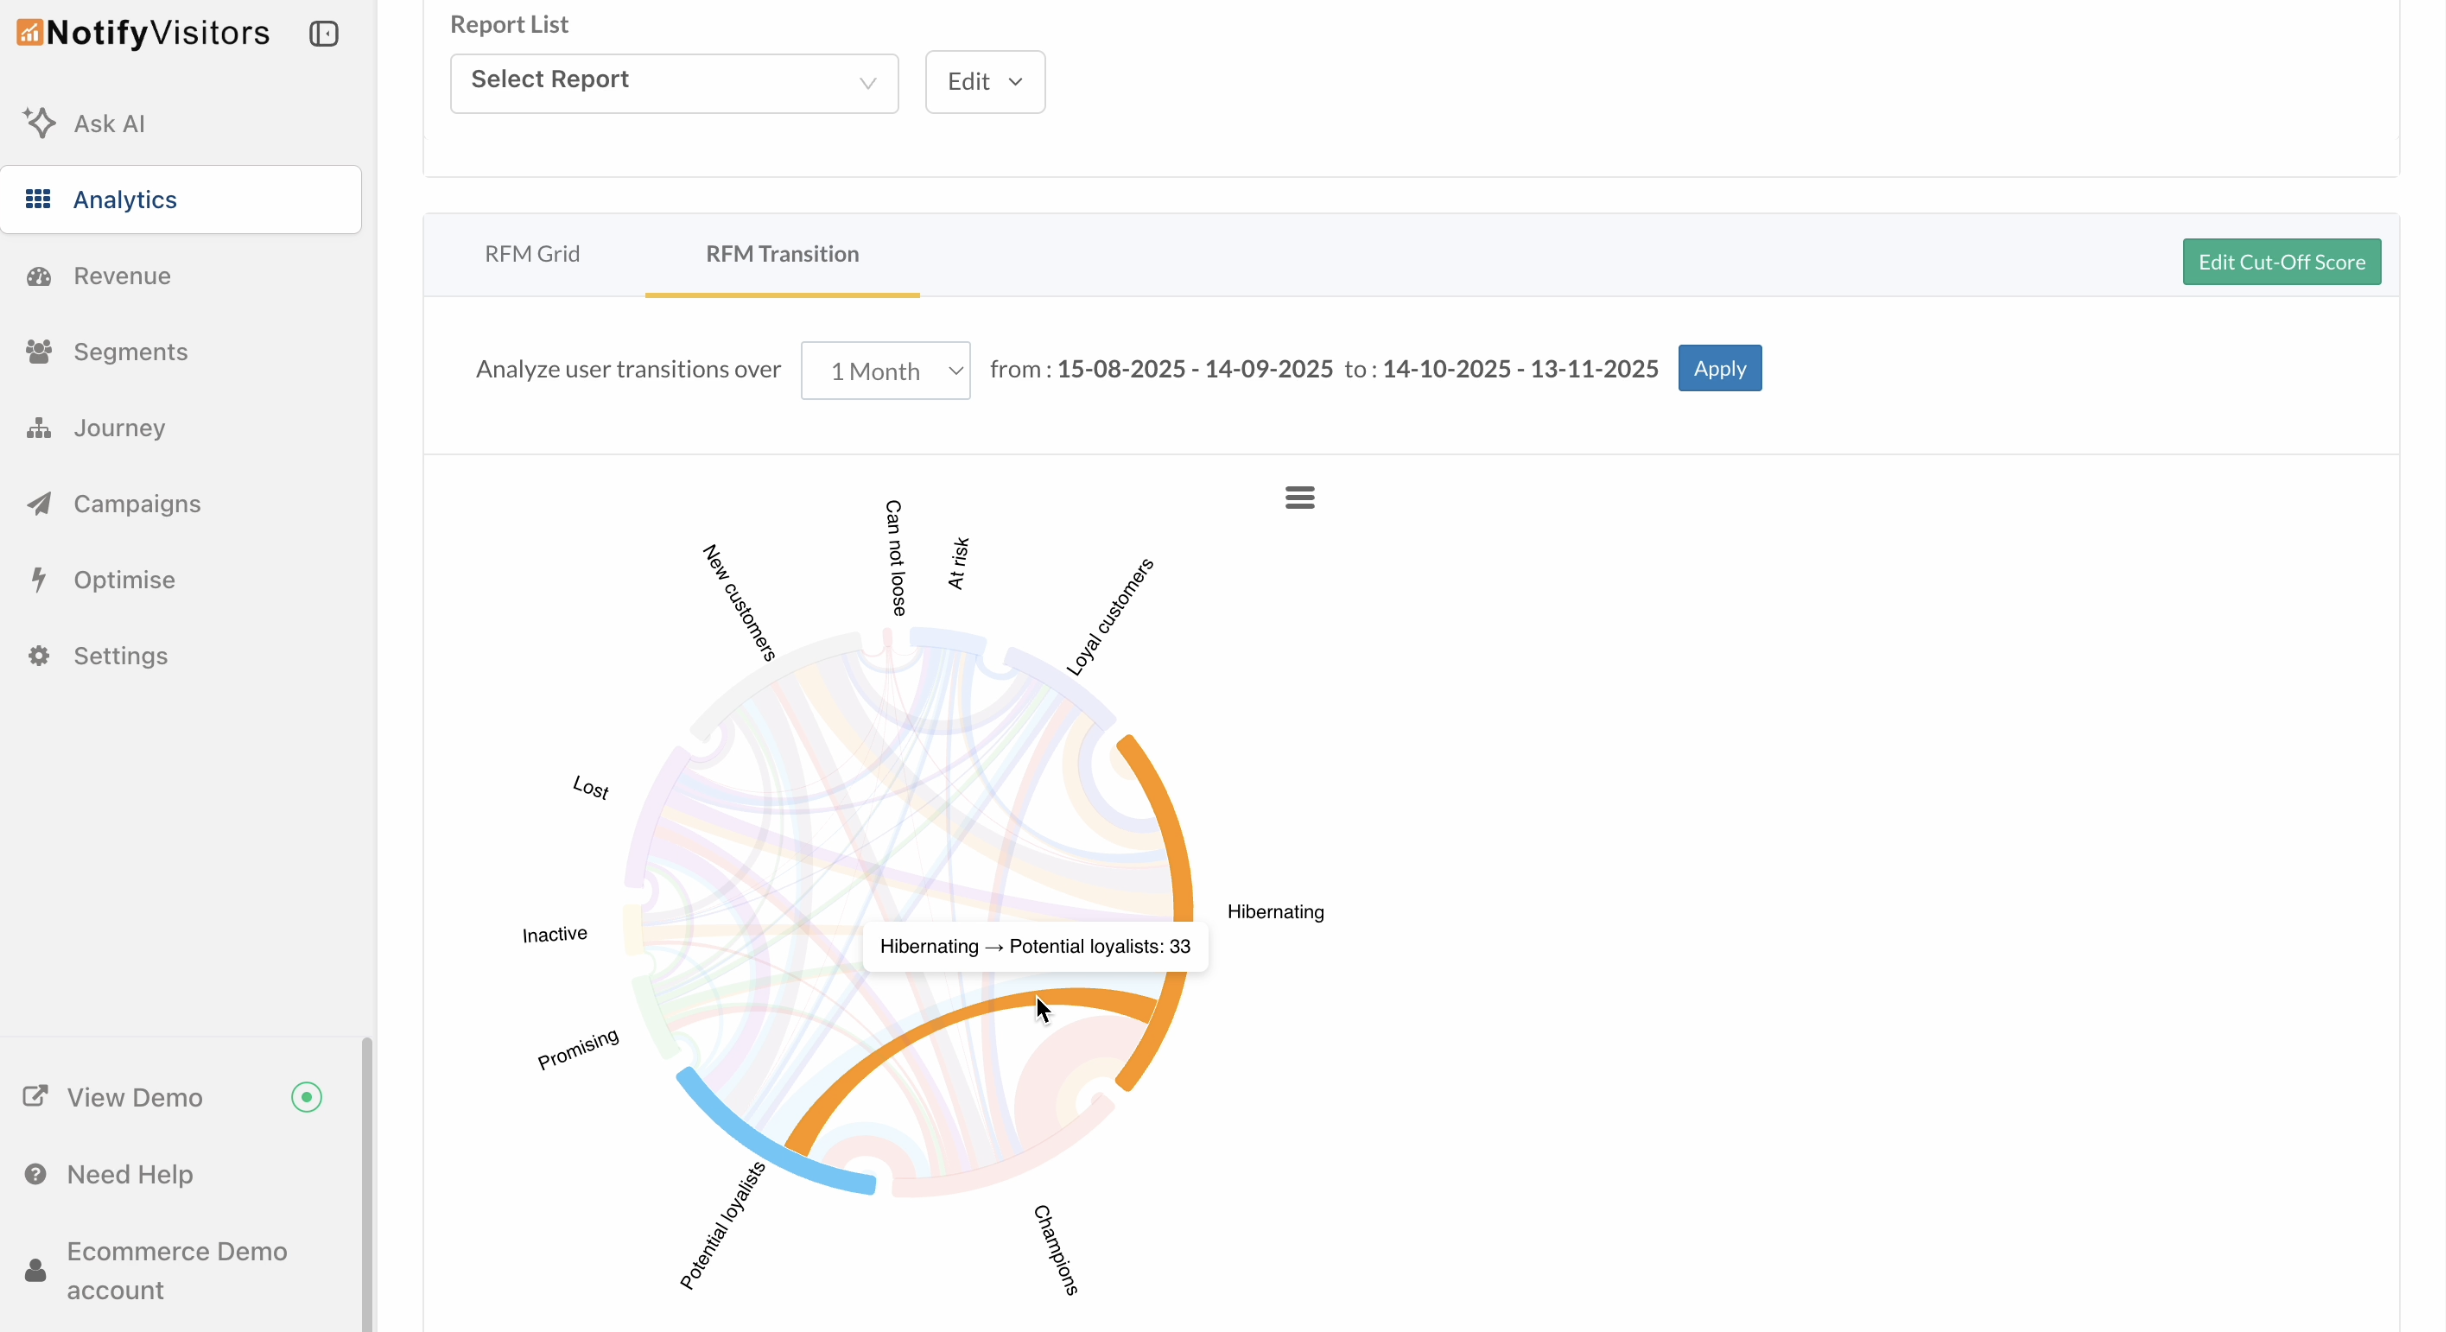
Hover over any colored line to see the segment users came from or moved to. Lines in the same color as a segment represent users who shifted from that segment to others. Lines in multiple colors represent users who shifted into that segment from different segments.
For example, the orange line in the above image shows users moving from Hibernating to Potential Loyalists, while the blue line in the image below shows users moving from Potential Loyalists into Hibernating.
- Switch to table view for a thorough analysis by selecting any specific segment.
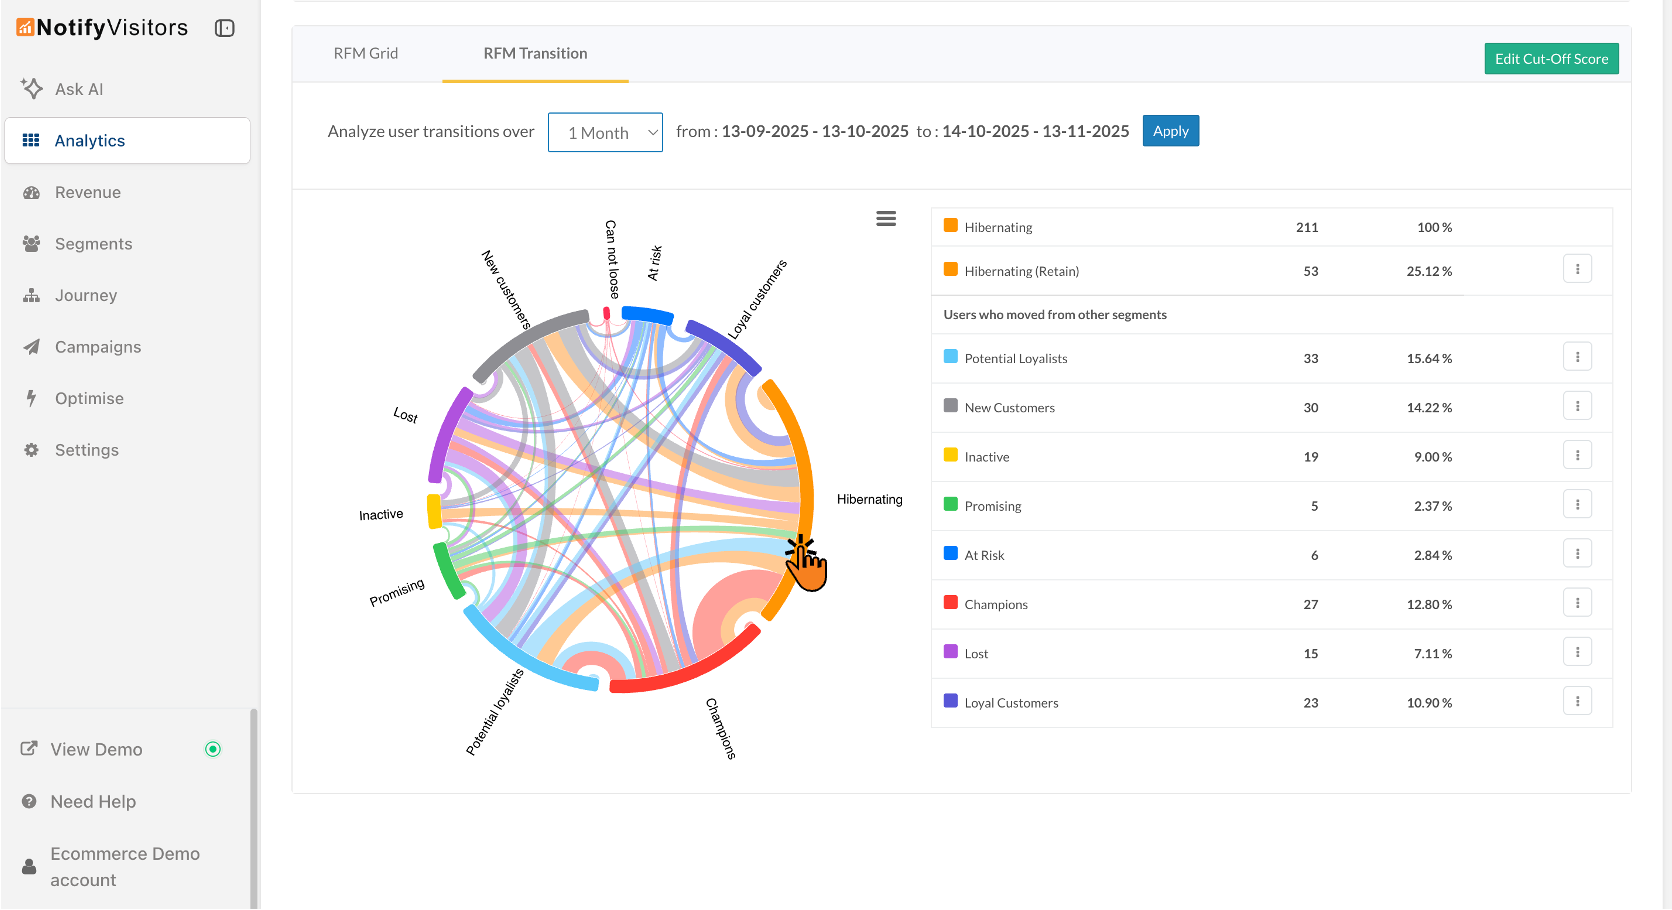
In the table, you’ll see the exact count and percentage for all three metrics:
- Total users in the segment,
- Retained (no shift within the defined window),
- Users who moved in from other segments—making it easy to prioritize win-backs and celebrate upgrades.
Practical Use Cases
- Campaign impact: Did your re-engagement series move users from At Risk → Loyal?
- Early churn signal: Are Loyal users drifting toward At Risk or Hibernating?
- Upsell moments: Who just became Champions so you can reward them?
Bottom line: RFM Transition turns segment shifts into clear visuals and hard numbers—so you can act faster on growth and churn, not guess.

At NotifyVisitors, we are constantly working to bring new features and improvements to our platform, based on the feedback and Read more

Introducing the May Release Notes – a roundup of the top upgrades and enhancements we've made to our platform this Read more

We are excited to announce a range of new features and enhancements in this month's release notes. These updates aim Read more

During this month, several significant updates have been implemented, with a primary focus on enhancing the marketing capabilities of our Read more