
 Email
Email SMS
SMS Whatsapp
 Web Push
 App Push
 Popups
 Channel A/B Testing
  Control groups Analysis
 Frequency Capping
 Funnel Analysis
 Cohort Analysis
 RFM Analysis
 Signup Forms
 Surveys
 NPS
NPS Landing pages personalization
  Website A/B Testing
  PWA/TWA
 Heatmaps
 Session Recording
 Wix
Wix Shopify
 Magento
 Woocommerce
 eCommerce D2C
  Mutual Funds
 Insurance
 Lending
  Recipes
  Product Updates
 App Marketplace
 Academy
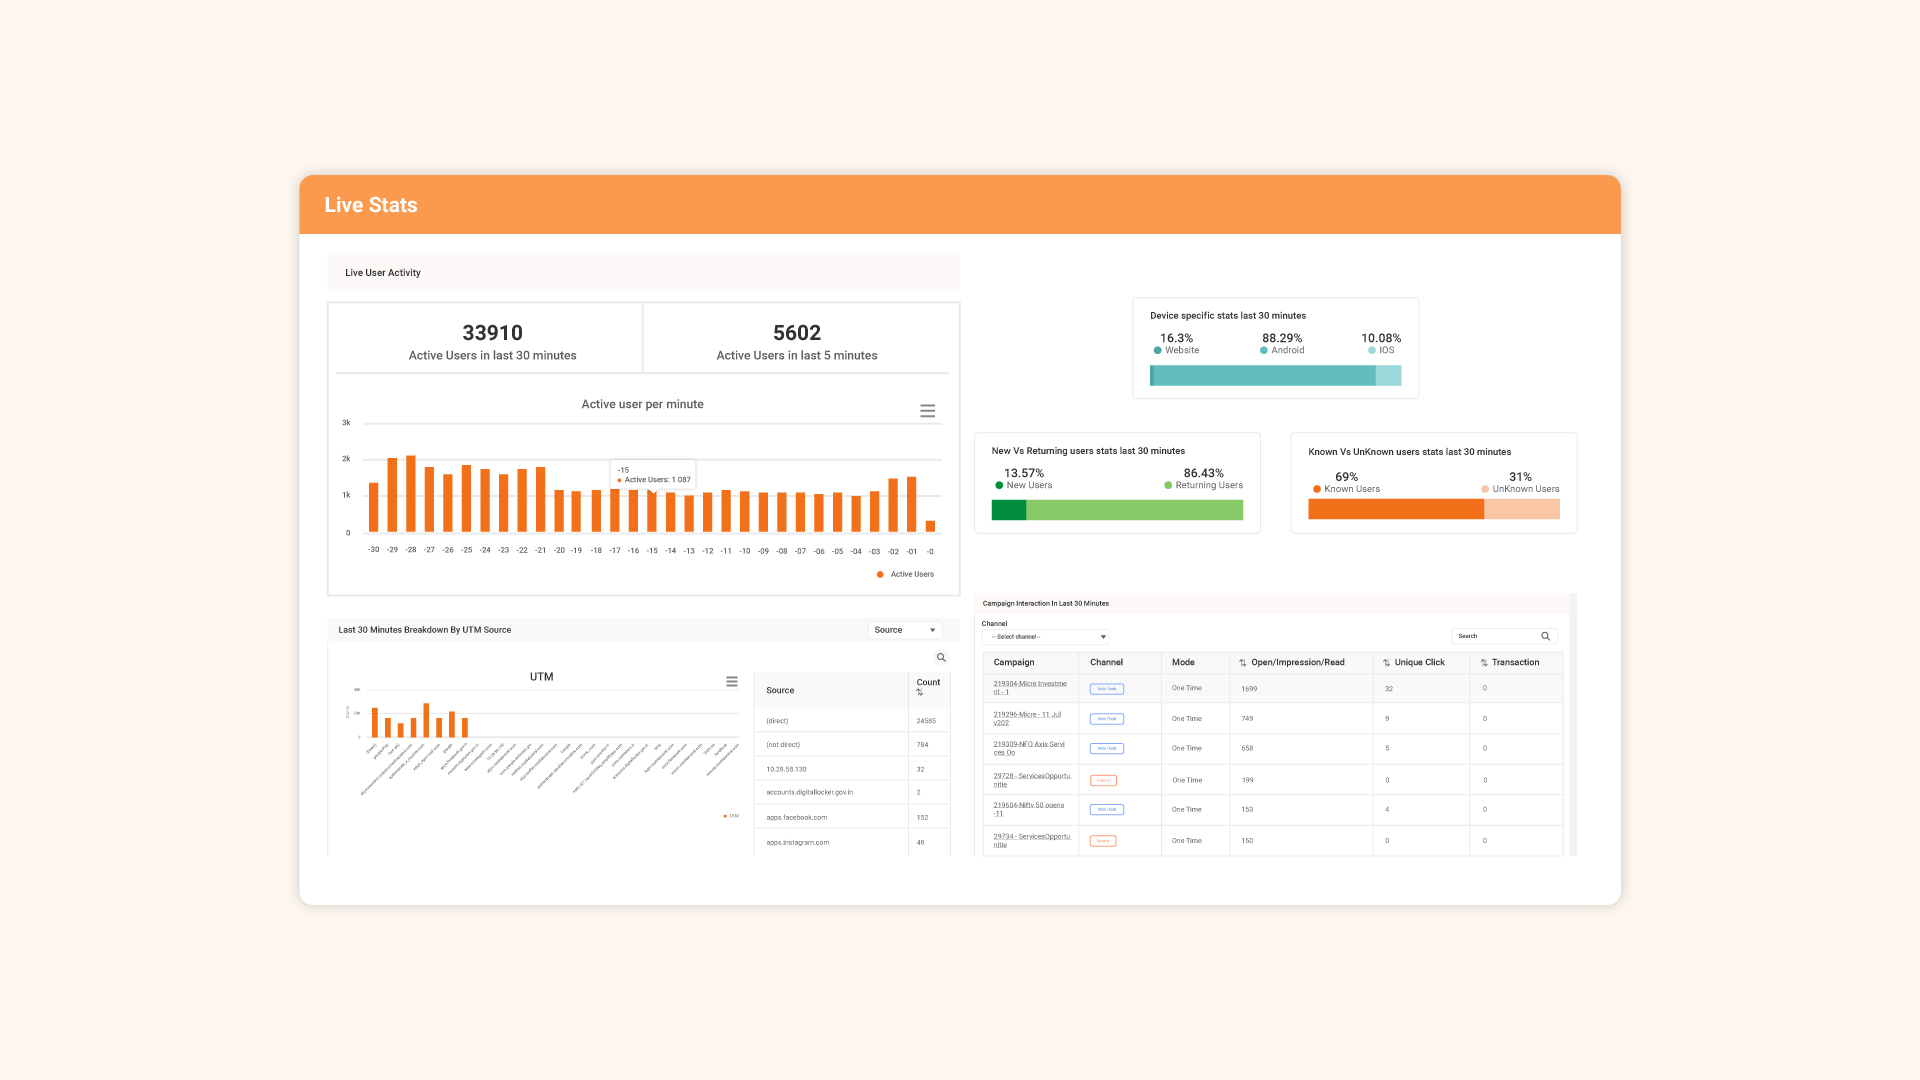
The Live Stats dashboard gives you real-time visibility into user activity on your platform, helping you monitor engagement and behavior trends instantly.
To access it, navigate to the Analytics section and click on the Live Stats tab.
What You’ll See:
1. Active Users Overview
At the top, you’ll find key performance indicators displaying:
- Total active users in the last 30 minutes
- Total active users in the last 5 minutes
- And a breakdown graph showing active users per minute.
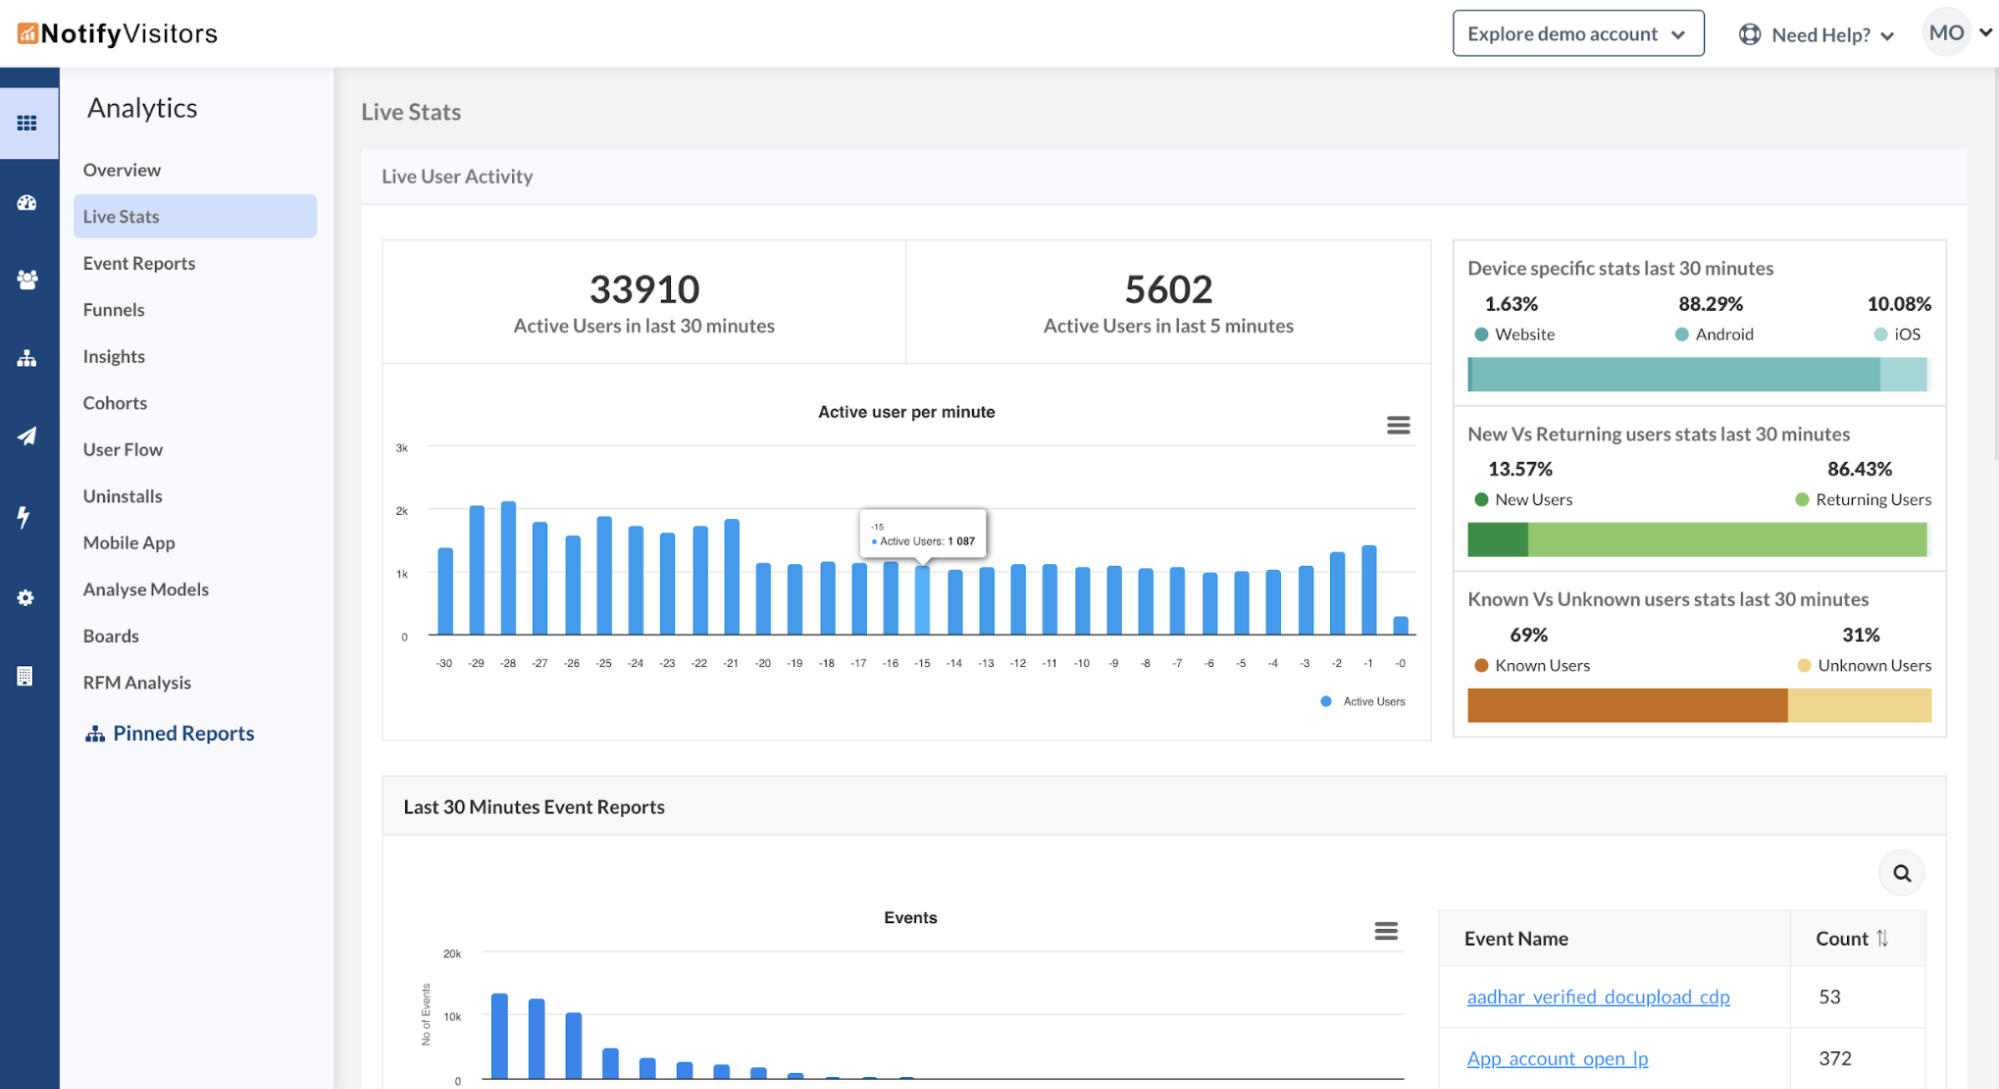
2. Device & User Type Breakdown (Last 30 Minutes)
On the right-hand side, visual bars compare:
- Device usage: Web, Android, iOS
- User type: New vs. Returning
- User identity: Known vs. Unknown
3. Event Activity
Just below, view a bar chart and a detailed table showing the number of events triggered in the last 30 minutes. You can see event names alongside their respective counts.
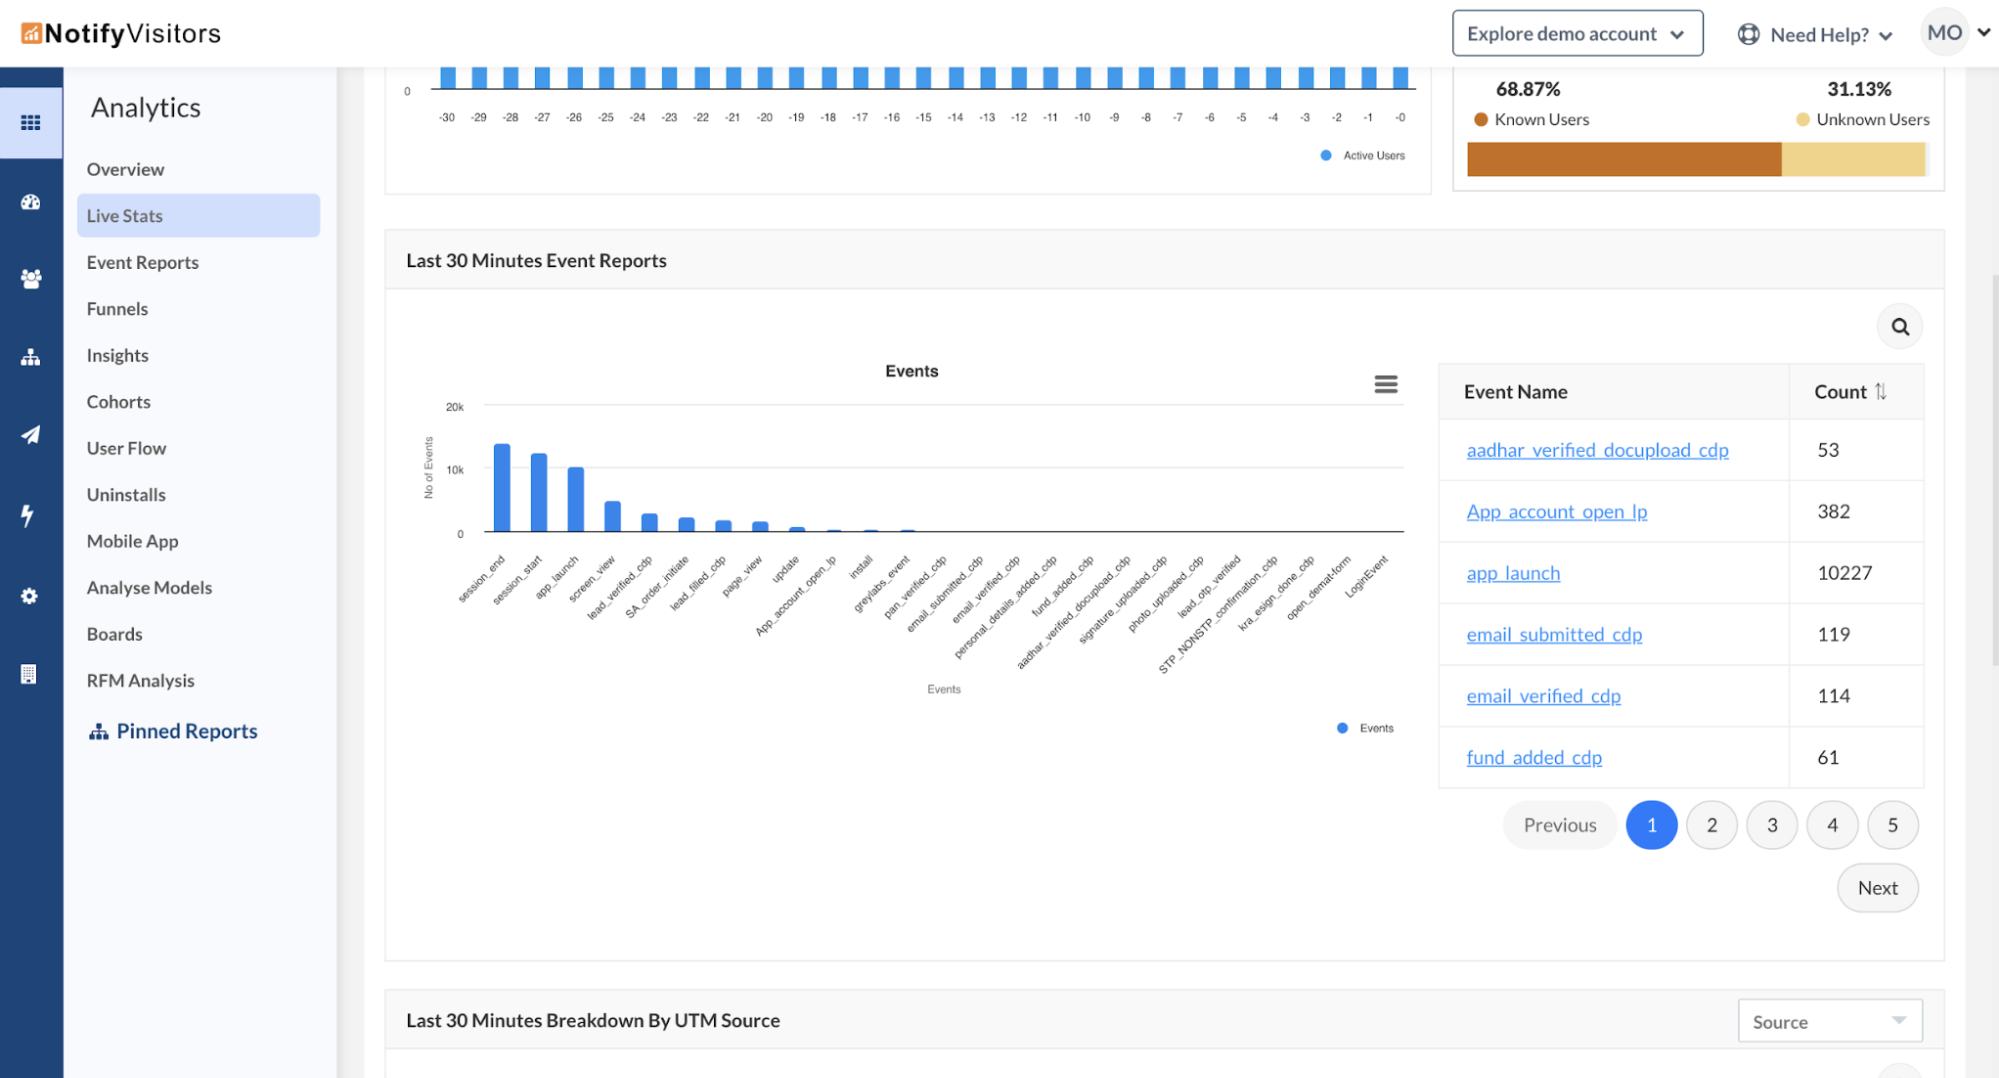
4. UTM Source Analysis
The next section highlights the breakdown of UTM sources, both as a chart and a table, giving insight into where your traffic is coming from in the last 30 minutes.
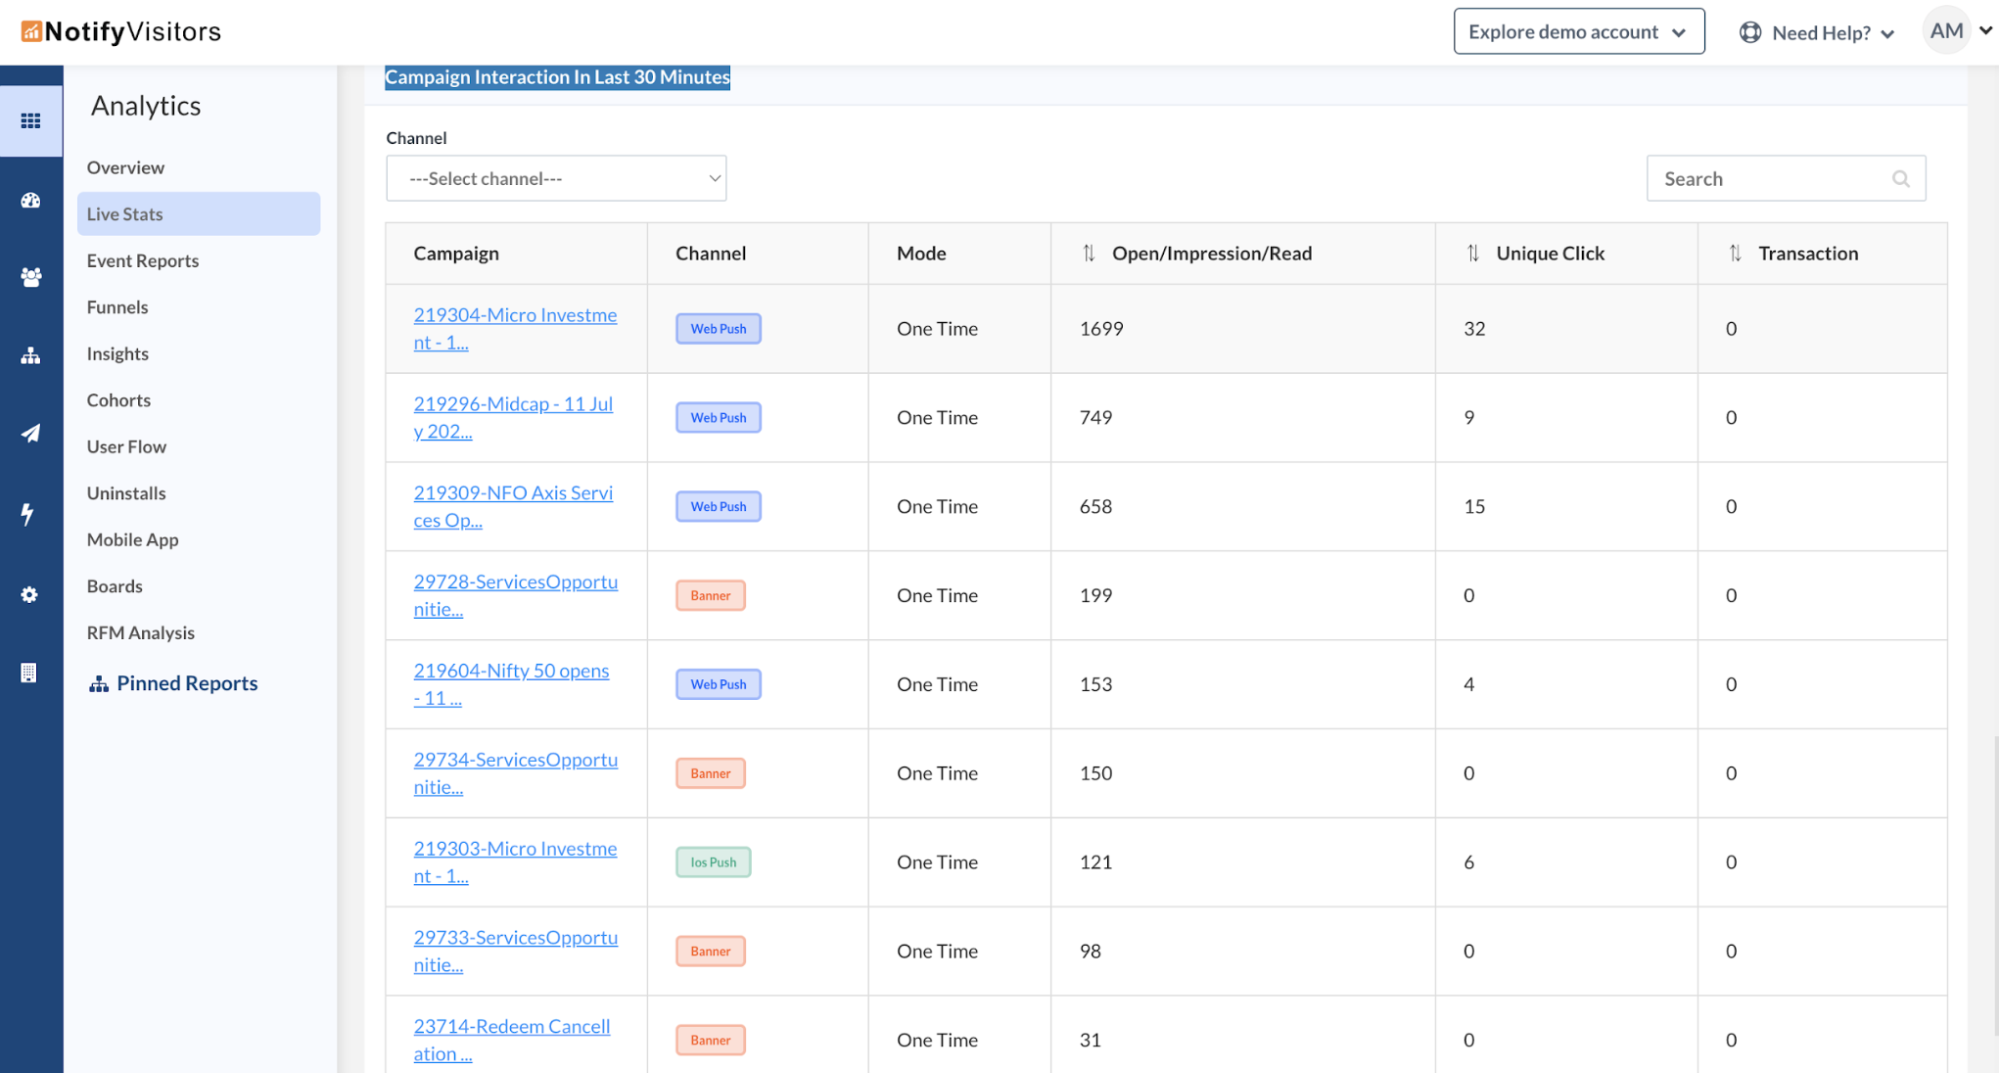
5. Campaign Interaction Insights
At the bottom, there’s a table listing campaign interactions within the last 30 minutes. For each campaign, you can see Campaign Name (clickable to view full campaign analytics), Channel, Mode, Open/Impression/Read Count, Unique Clicks, and Transactions.
This dashboard is designed for teams who need immediate access to live user behavior to act fast and optimize in real time.

At NotifyVisitors, we are constantly working to bring new features and improvements to our platform, based on the feedback and Read more

Introducing the May Release Notes – a roundup of the top upgrades and enhancements we've made to our platform this Read more

We are excited to announce a range of new features and enhancements in this month's release notes. These updates aim Read more

During this month, several significant updates have been implemented, with a primary focus on enhancing the marketing capabilities of our Read more