
 Email
Email SMS
SMS Whatsapp
 Web Push
 App Push
 Popups
 Channel A/B Testing
  Control groups Analysis
 Frequency Capping
 Funnel Analysis
 Cohort Analysis
 RFM Analysis
 Signup Forms
 Surveys
 NPS
NPS Landing pages personalization
  Website A/B Testing
  PWA/TWA
 Heatmaps
 Session Recording
 Wix
Wix Shopify
 Magento
 Woocommerce
 eCommerce D2C
  Mutual Funds
 Insurance
 Lending
  Recipes
  Product Updates
 App Marketplace
 Academy
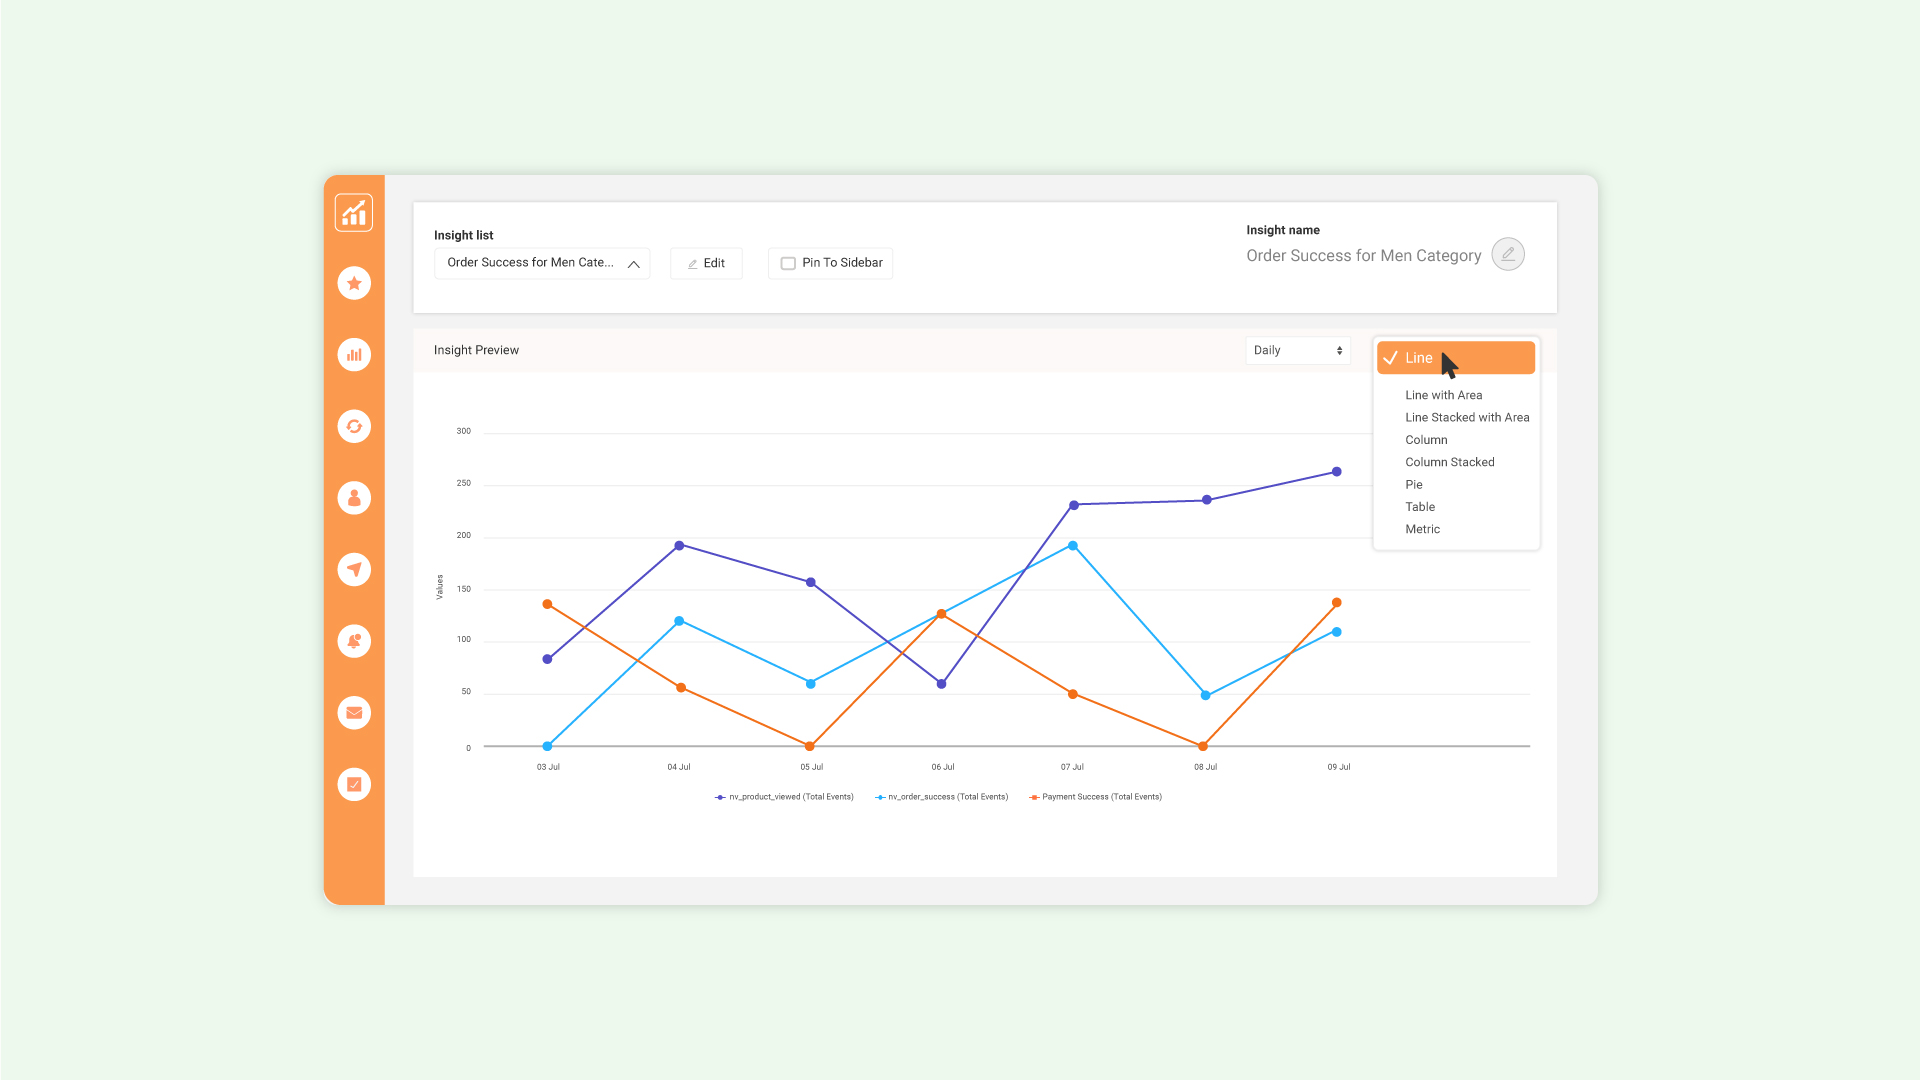
The all-new Insights section gives you the power to compare and analyze multiple events at once, along with different attributes and trend types like total events or unique users. It offers deeper visibility into user behavior, going beyond what the standard event reports section provides.
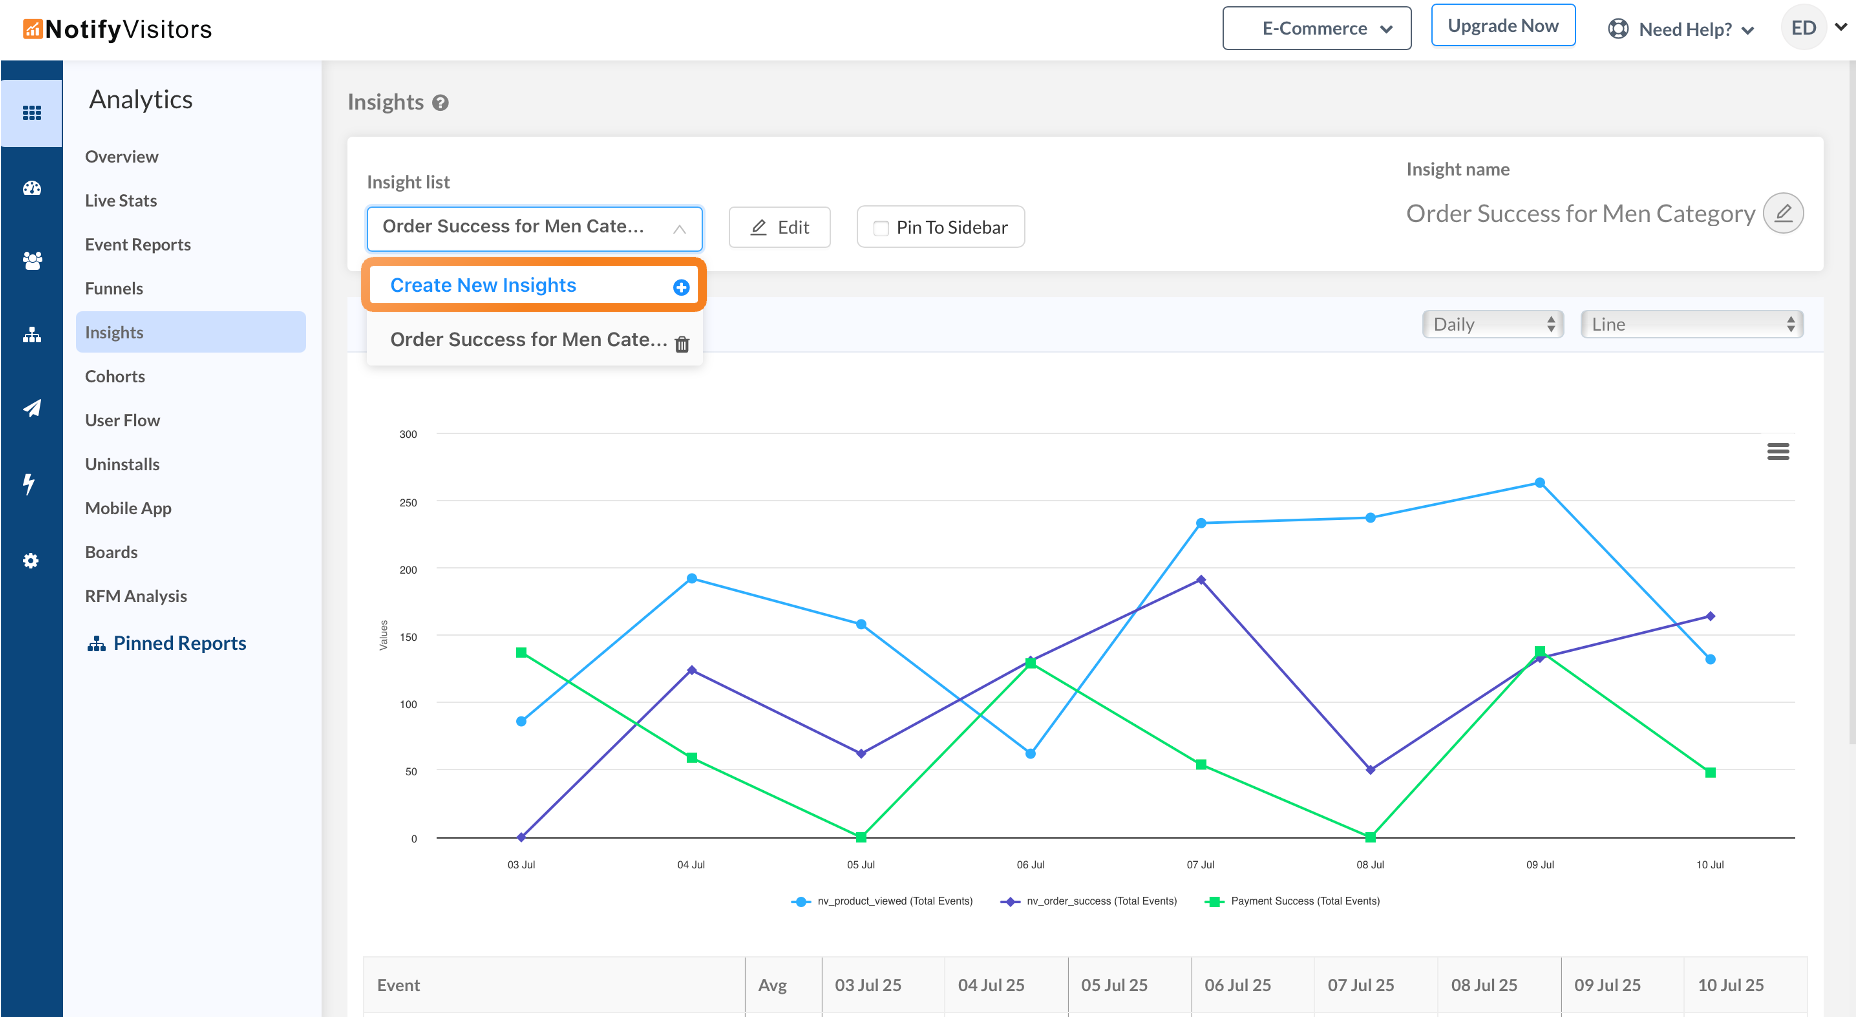
To get started, navigate to the Analytics panel and click on Insights. Use the Insights list dropdown to create a new report. If it’s your first visit, you’ll see a Create button right away.
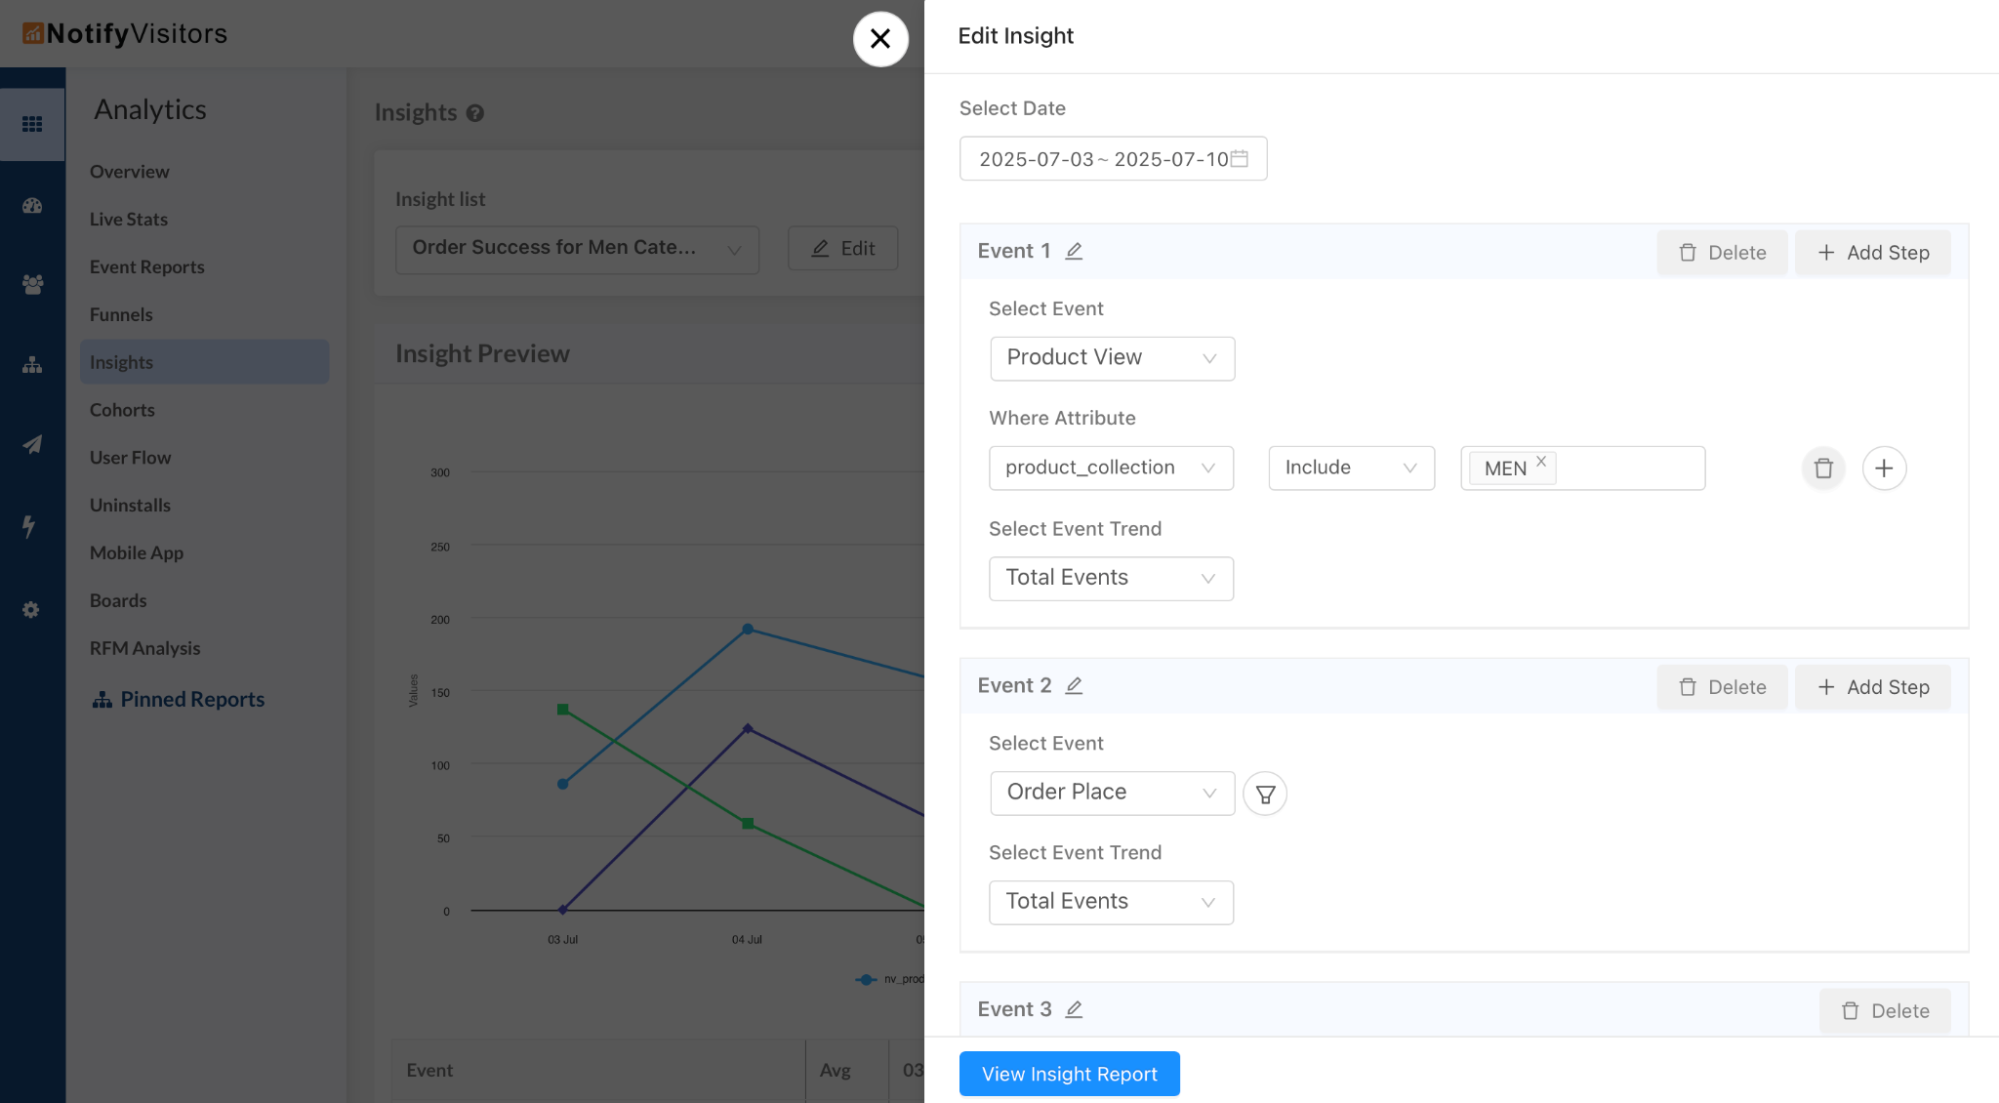
You’ll then enter the Edit Insight window. Here, select the date range you want to analyze, choose an event, apply attribute filters if needed, and pick the trend type you’d like to track (e.g., total events, unique users, etc.). To compare multiple events in the same view, click the Add Step button and repeat the process for each additional event.
Once your setup is complete, click View Insight Report. A preview section will display your selected events as a graph and a table for easy comparison. From the dropdown at the top right, you can change the chart type. Available options include: Line, Line with Area, Stacked Line, Column, Stacked Column, Pie, Table, and Metric.
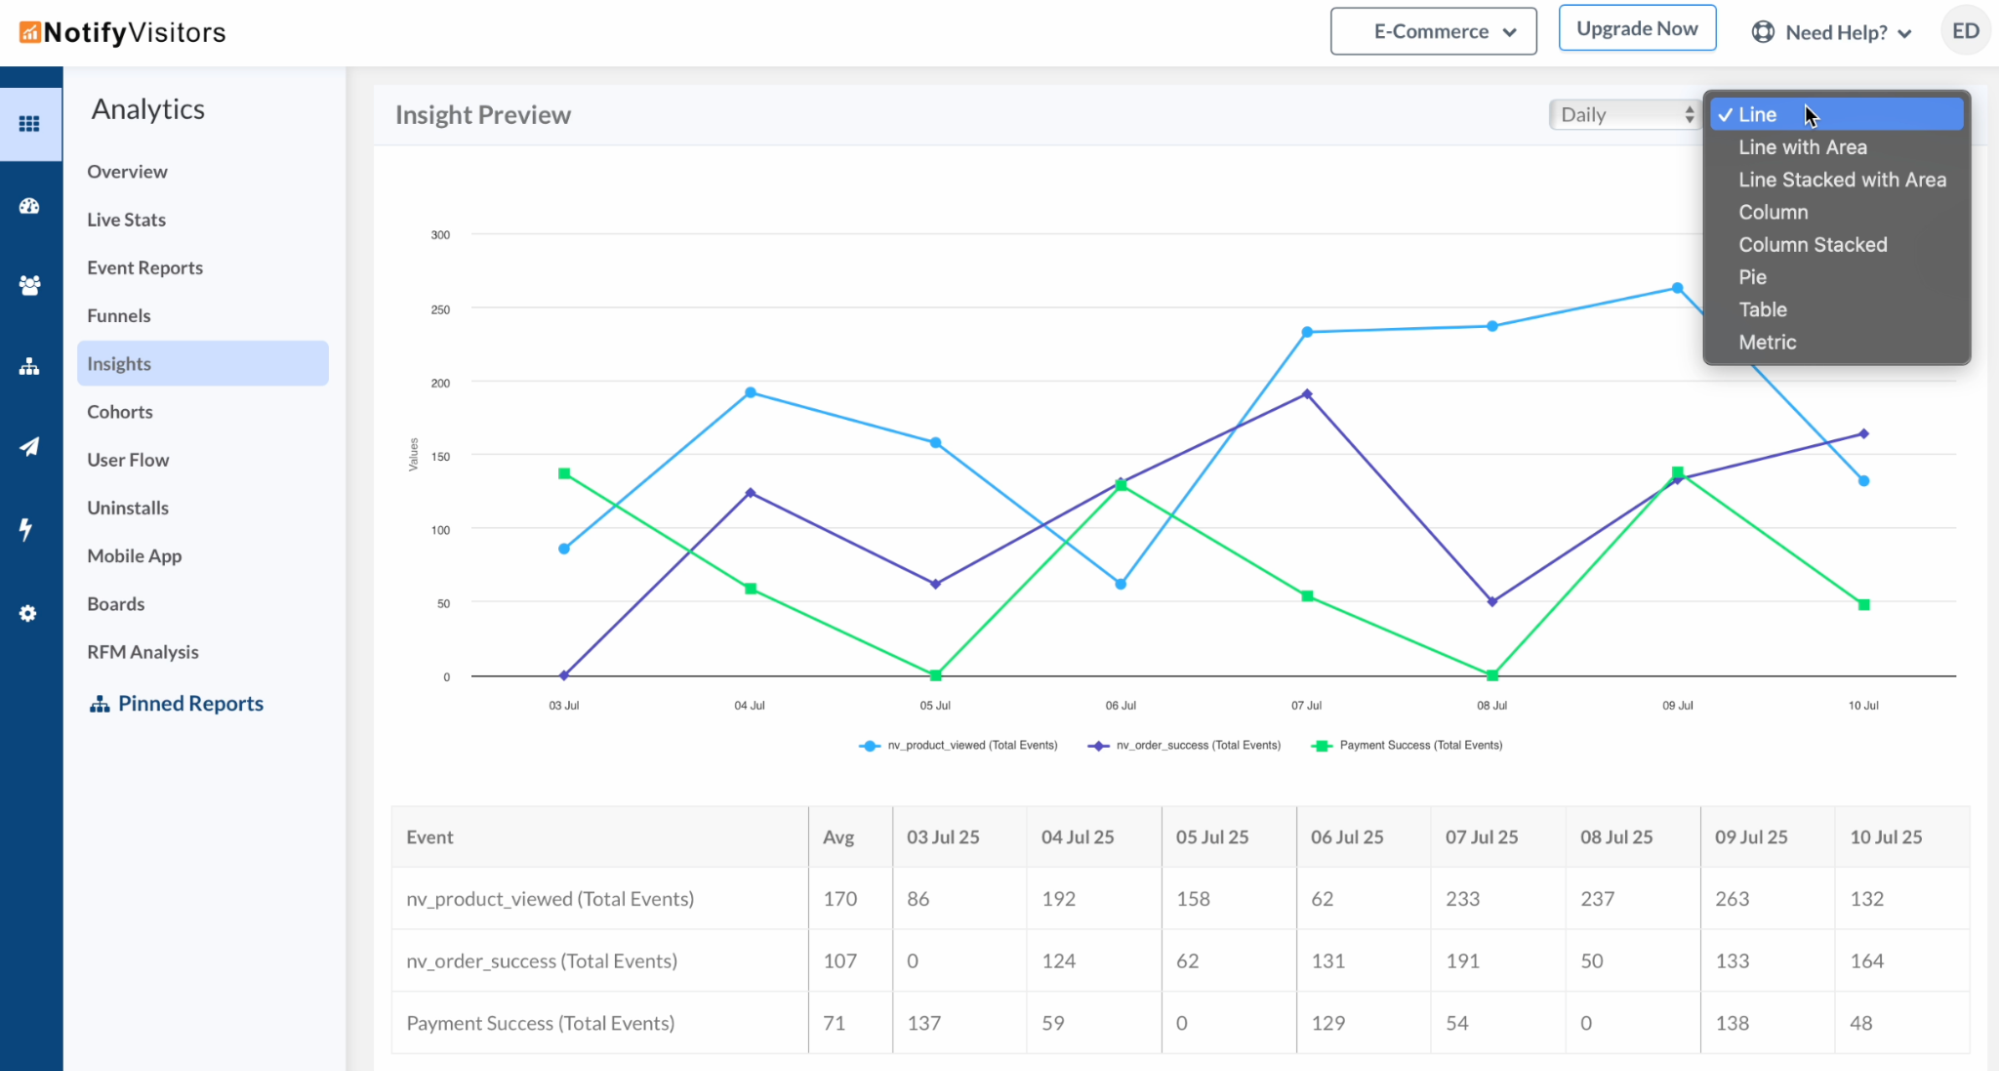
Additionally, you can toggle visibility of specific events in the graph by clicking their names at the bottom, ideal for focusing on particular metrics without altering your report.
To save your work, click Save button at the top, give your report a name, click Create, and it will appear in the Insights list for future access.
This enhanced Insights section helps you quickly compare key user actions across events, making trend analysis more flexible, visual, and insightful.

At NotifyVisitors, we are constantly working to bring new features and improvements to our platform, based on the feedback and Read more

Introducing the May Release Notes – a roundup of the top upgrades and enhancements we've made to our platform this Read more

We are excited to announce a range of new features and enhancements in this month's release notes. These updates aim Read more

During this month, several significant updates have been implemented, with a primary focus on enhancing the marketing capabilities of our Read more