
 Email
Email SMS
SMS Whatsapp
 Web Push
 App Push
 Popups
 Channel A/B Testing
  Control groups Analysis
 Frequency Capping
 Funnel Analysis
 Cohort Analysis
 RFM Analysis
 Signup Forms
 Surveys
 NPS
NPS Landing pages personalization
  Website A/B Testing
  PWA/TWA
 Heatmaps
 Session Recording
 Wix
Wix Shopify
 Magento
 Woocommerce
 eCommerce D2C
  Mutual Funds
 Insurance
 Lending
  Recipes
  Product Updates
 App Marketplace
 Academy
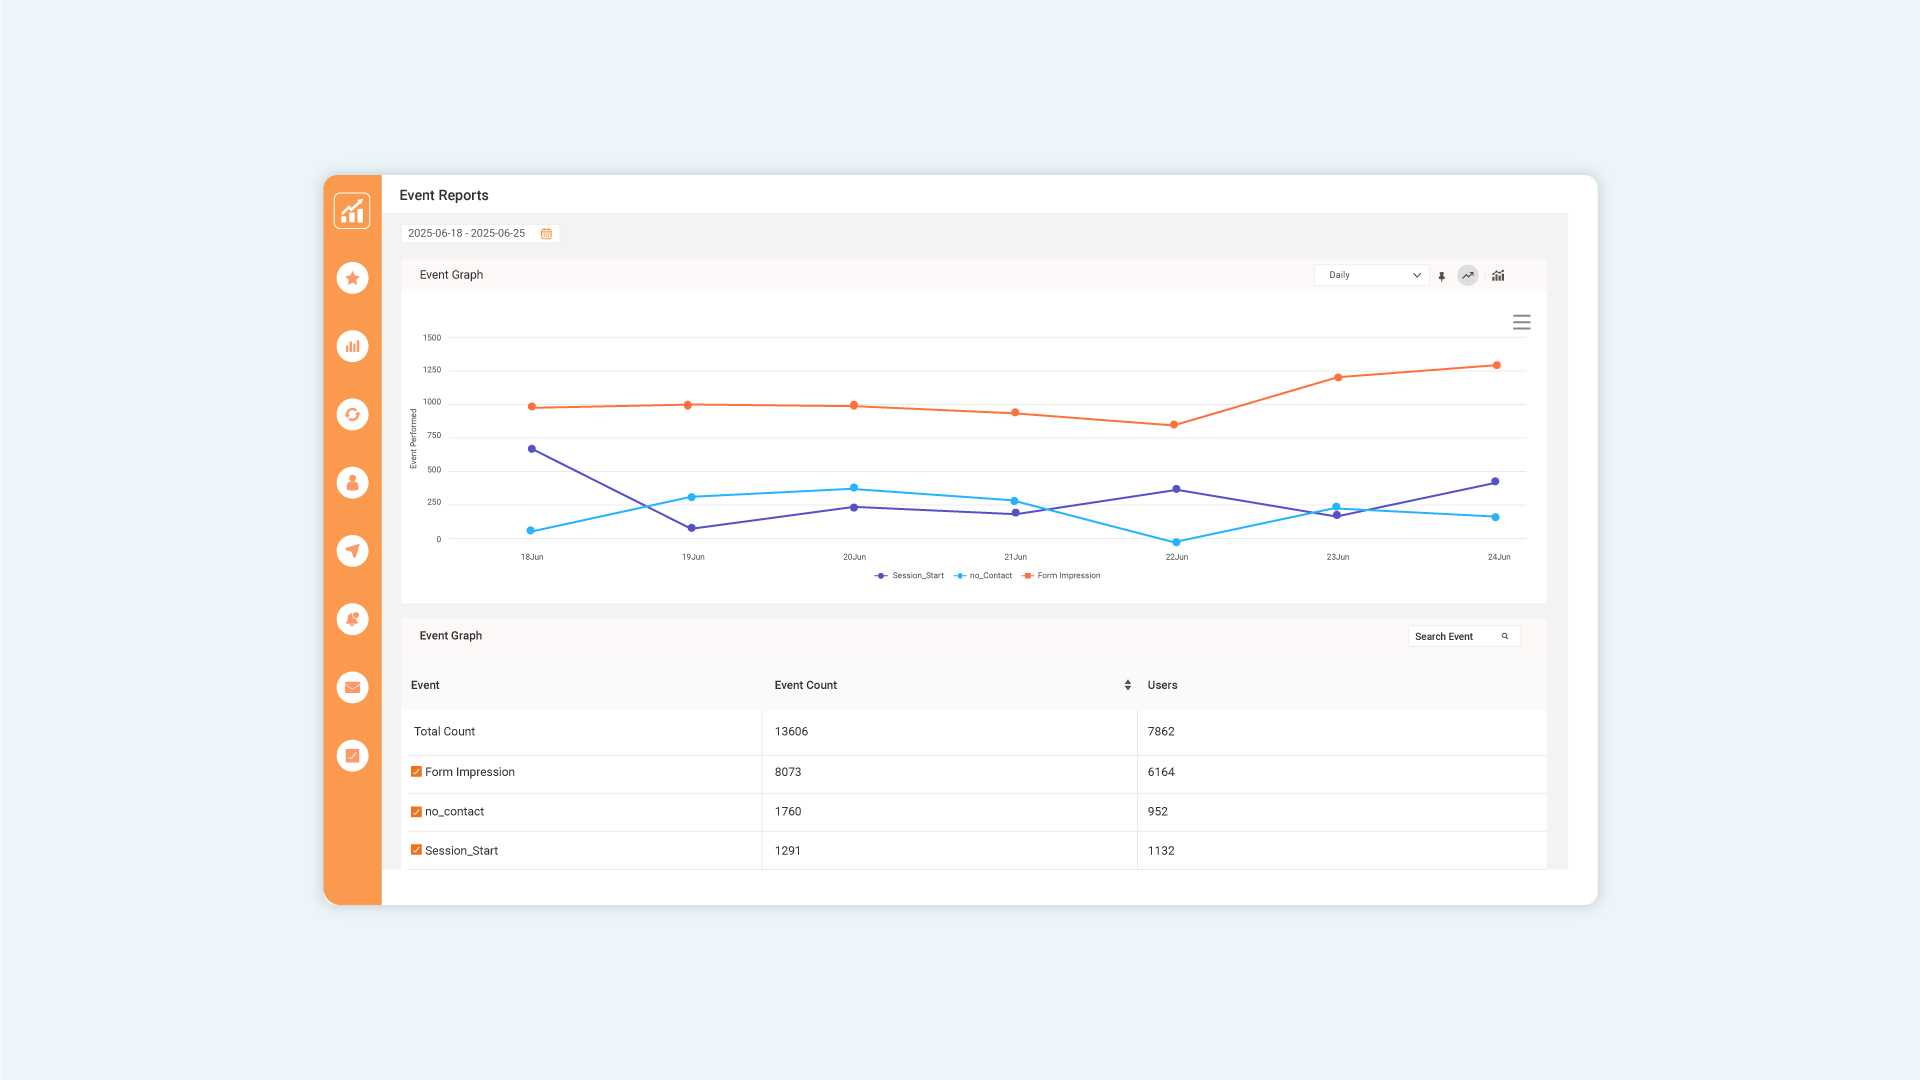
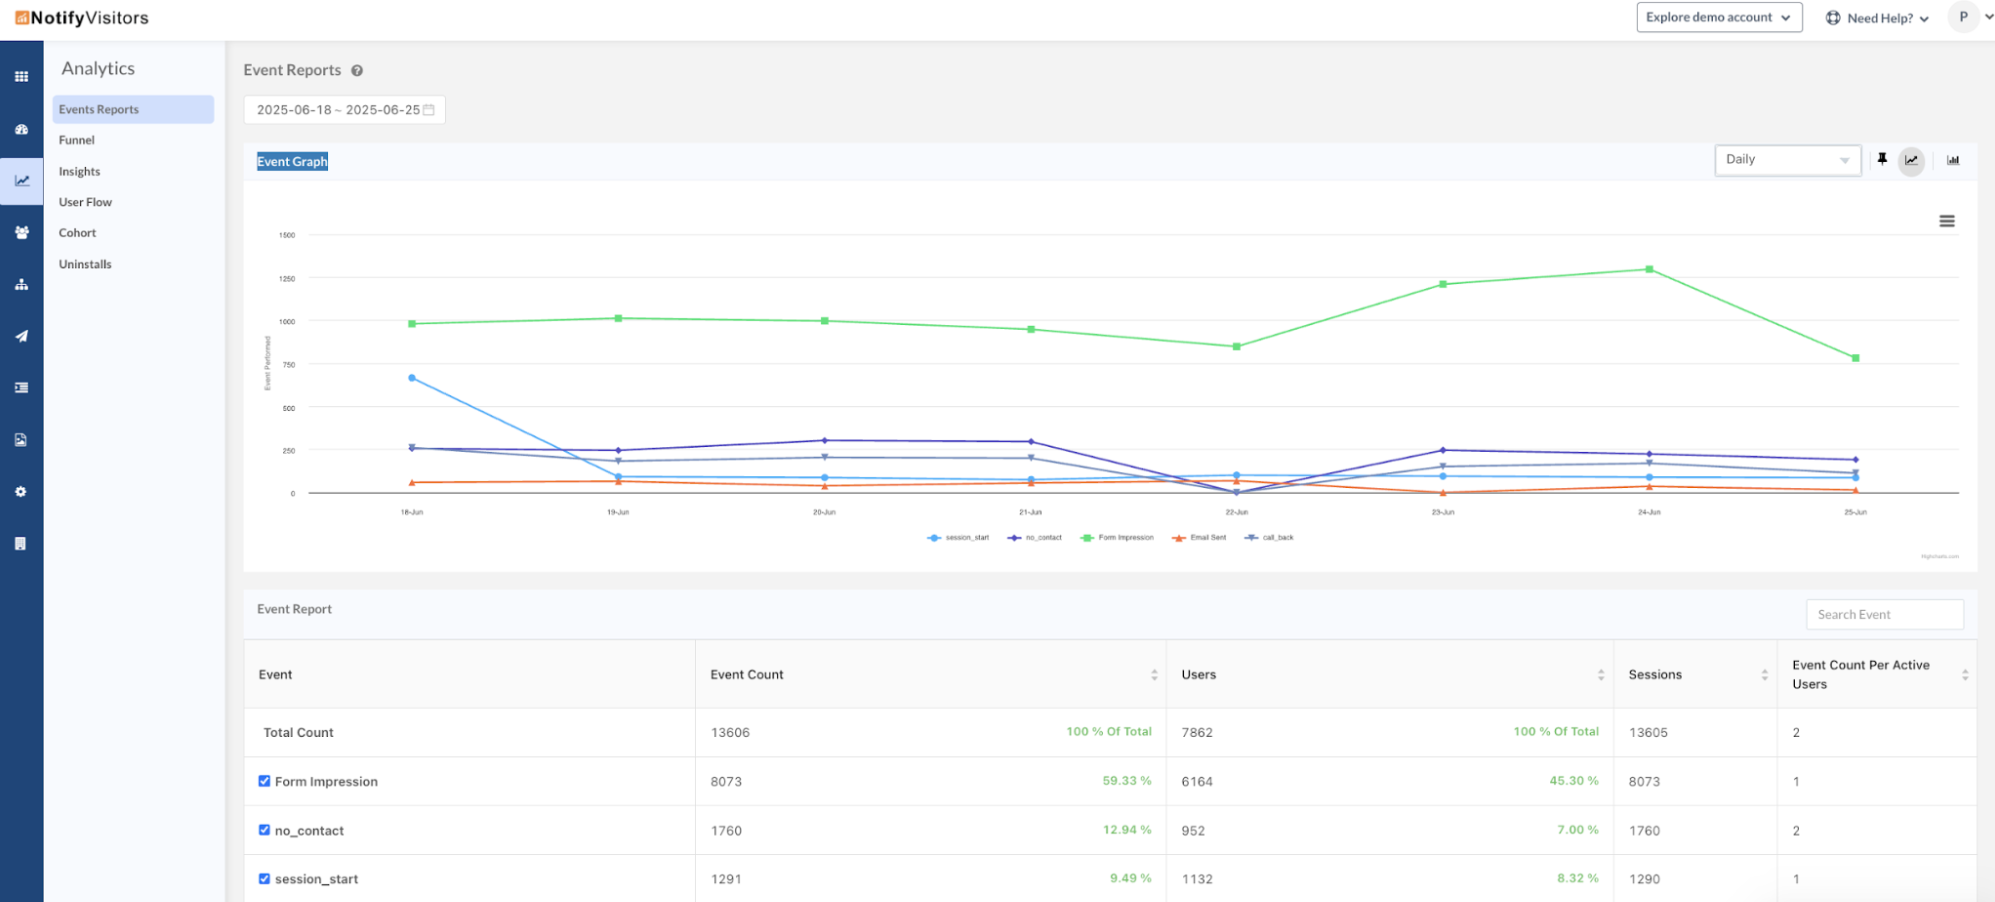
We’ve made significant improvements to the Event Reports section to help you better understand user behavior through event analytics.
At the top, we now have the Overview section, which displays a graph of the top 5 events based on performance. This visual snapshot gives you quick insights into which events are most active.
Below the graph, you’ll find a detailed list of all tracked events, including key metrics like event count, the number of users who performed each event, associated sessions, and event count per active user. This tabular breakdown helps you identify trends and compare event performance at a glance.
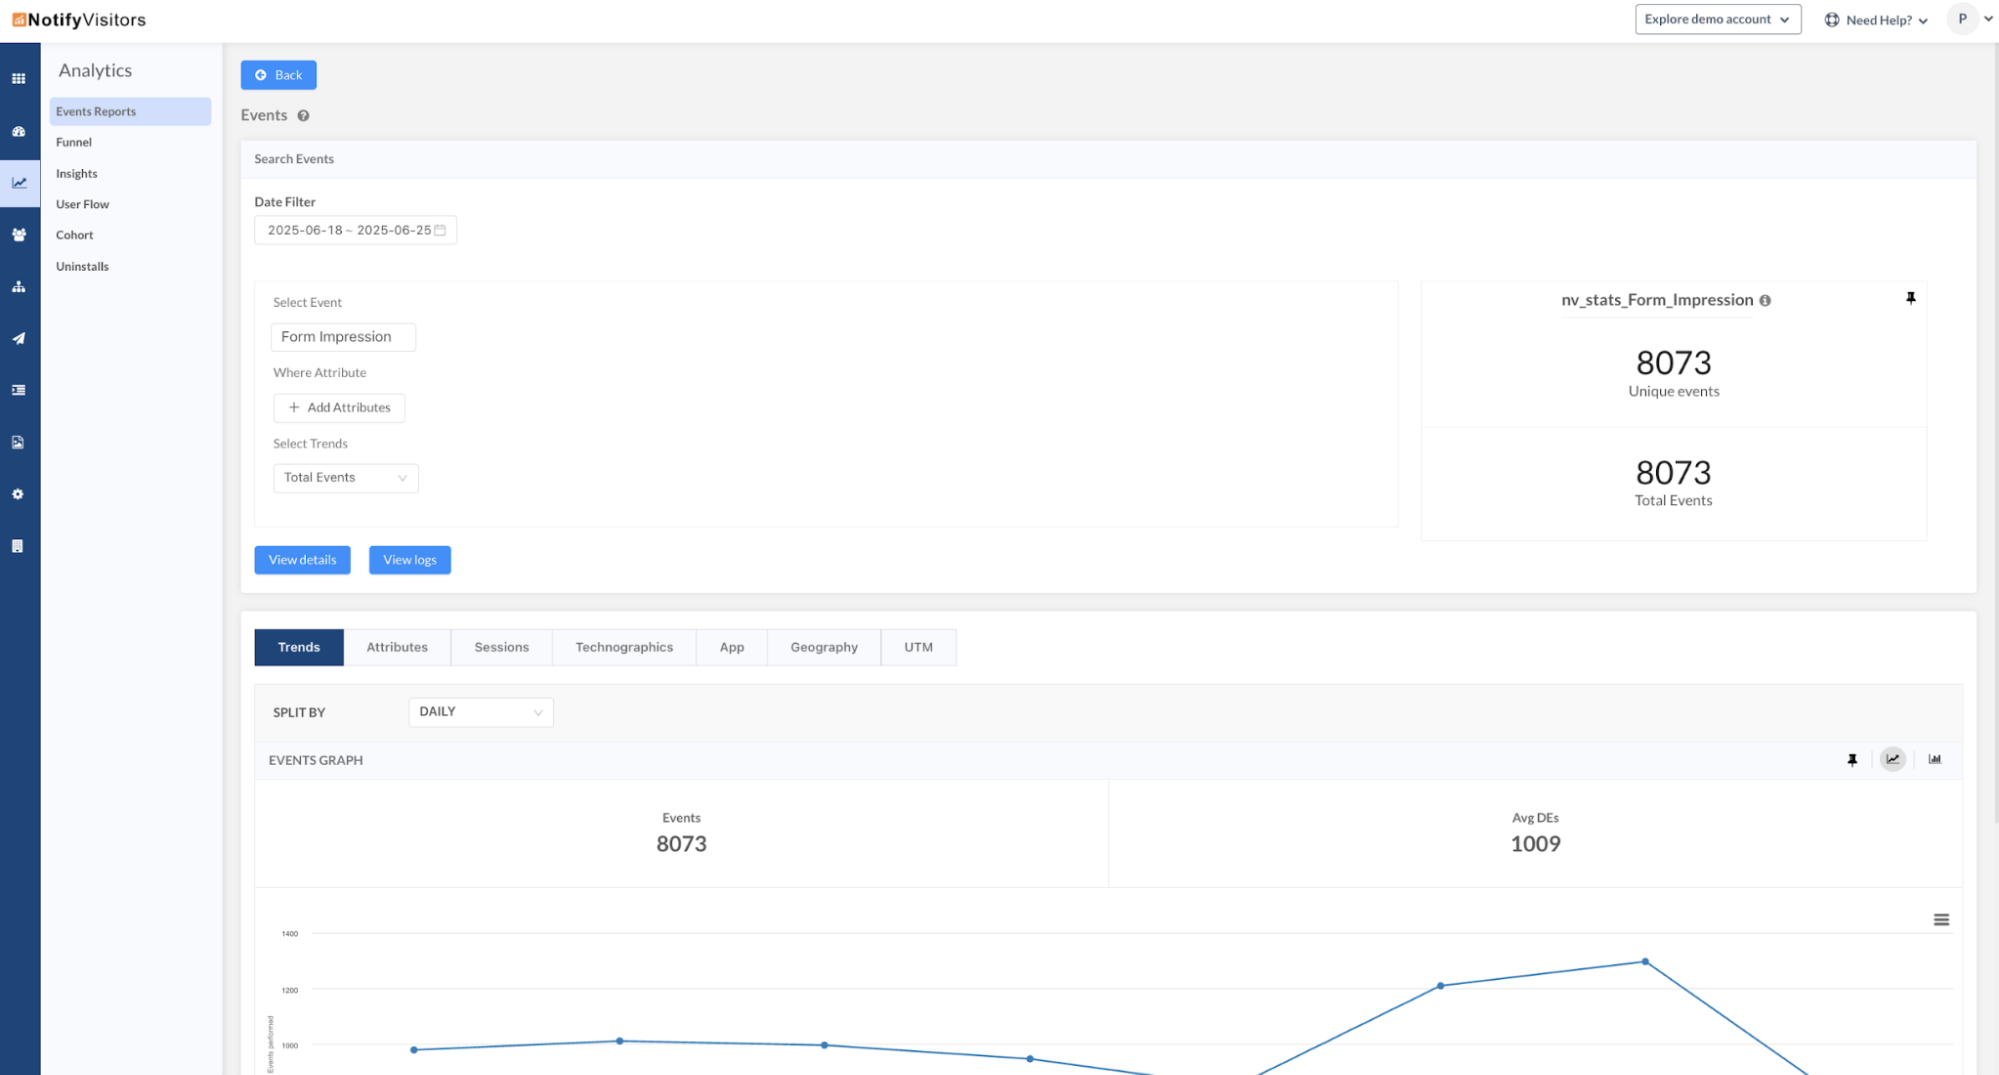
To dive deeper, simply click on any event name or use the search bar to find a specific event. Once selected, you’ll be redirected to a detailed analytics view, familiar from previous versions, where you can apply attribute filters, switch between different trend types (like total events, unique events, etc.), and explore insights by trends, attributes, sessions, technographics, and more.
This revamped layout makes it easier than ever to analyze event performance and extract meaningful data to guide your marketing or product decisions.

At NotifyVisitors, we are constantly working to bring new features and improvements to our platform, based on the feedback and Read more

Introducing the May Release Notes – a roundup of the top upgrades and enhancements we've made to our platform this Read more

We are excited to announce a range of new features and enhancements in this month's release notes. These updates aim Read more

During this month, several significant updates have been implemented, with a primary focus on enhancing the marketing capabilities of our Read more