
 Email
Email SMS
SMS Whatsapp
 Web Push
 App Push
 Popups
 Channel A/B Testing
  Control groups Analysis
 Frequency Capping
 Funnel Analysis
 Cohort Analysis
 RFM Analysis
 Signup Forms
 Surveys
 NPS
NPS Landing pages personalization
  Website A/B Testing
  PWA/TWA
 Heatmaps
 Session Recording
 Wix
Wix Shopify
 Magento
 Woocommerce
 eCommerce D2C
  Mutual Funds
 Insurance
 Lending
  Recipes
  Product Updates
 App Marketplace
 Academy
NotifyVisitors’ Composable CDP allows you to connect your own data lake via Data Connector and build custom user/event models for analytics, segmentation, and more — all within the platform.
Data Connector – Sources
The Sources feature enables you to securely connect structured external data sources. Go to Settings > Data Connector > Sources to add a source.
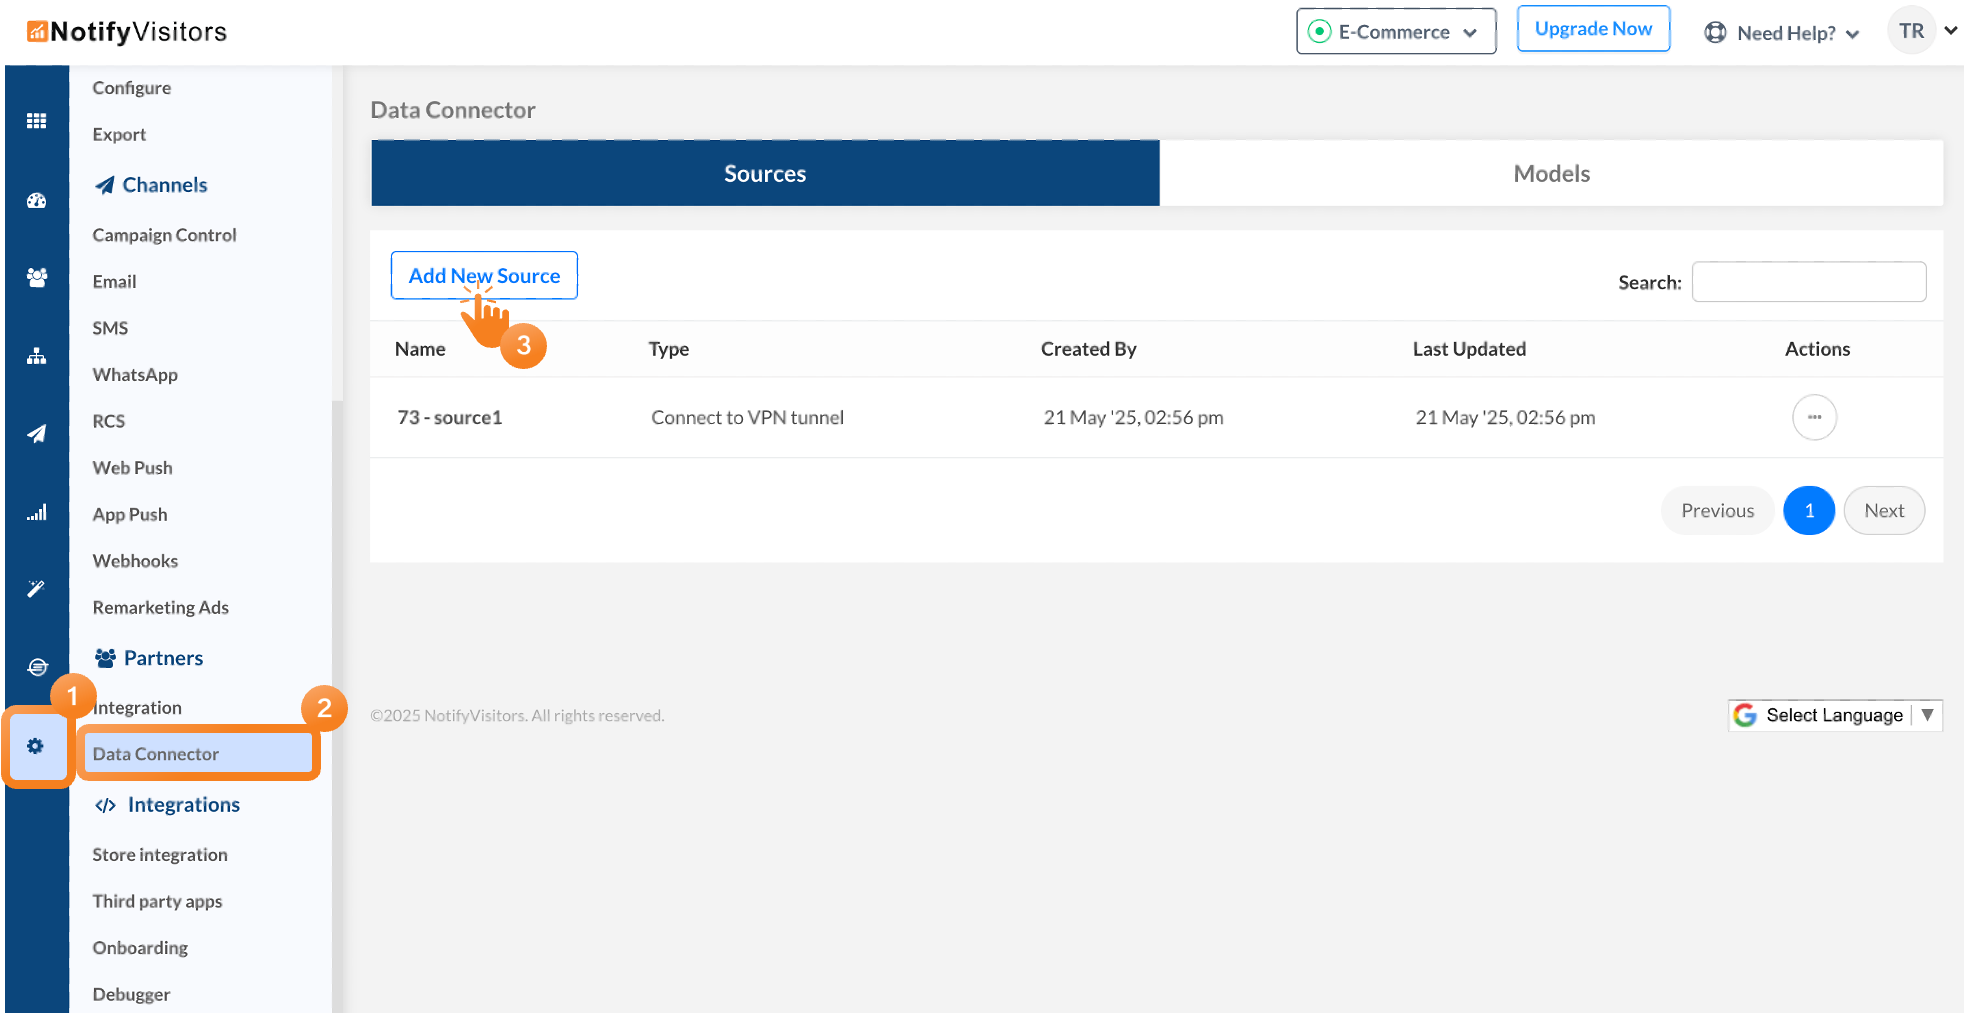
A guided 3-step setup helps you:
- Select a source (currently only Amazon Redshift is available)
- Enter connection details (name, type, credentials)
- Complete backend validation
Once everything is verified, the source is successfully added and ready to be used for building models.
Data Connectors – Models
The Models feature lets you map the data synced from your connected sources with NotifyVisitors attributes. Under Data Connector > Models, click Add New Model and follow the 3-step process:
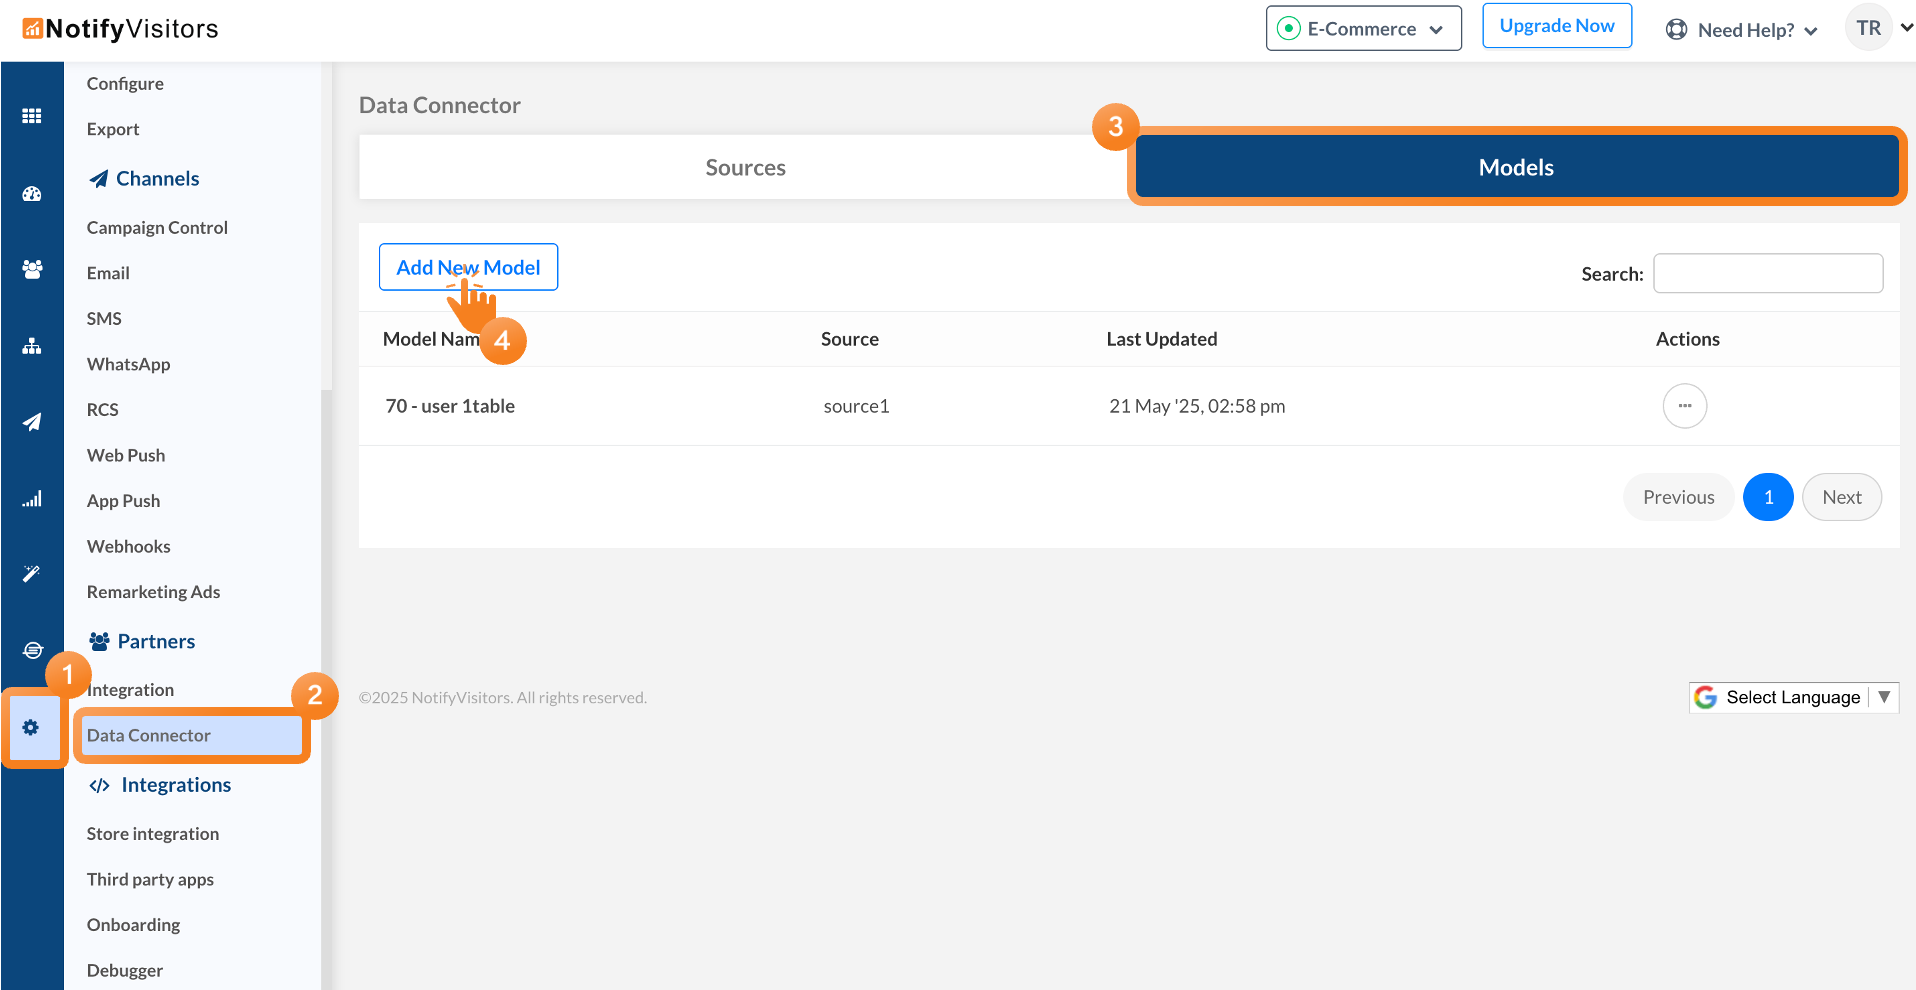
- Choose a source and preview tables
- Define model details (name, type, primary key) and Map identifiers (Same Model or Reference Model) to NotifyVisitors attributes
- Map each column from the source table to a corresponding NotifyVisitors attribute.
Once completed, the model is saved and added to the Models list, ready for use in analytics, segmentation, and more.
Creating Model-Based Segments
To create a segment using your models in NotifyVisitors, navigate to Segments > Create Segment > Query-Based Segment.

Select your preferred data source from the dropdown. With this, you’ll enter the segment creation interface where you can select multiple models, along with attribute-wise filter and group conditions (“Any” or “All”). Lastly, enable Precomputed Segments to auto-sync updates.
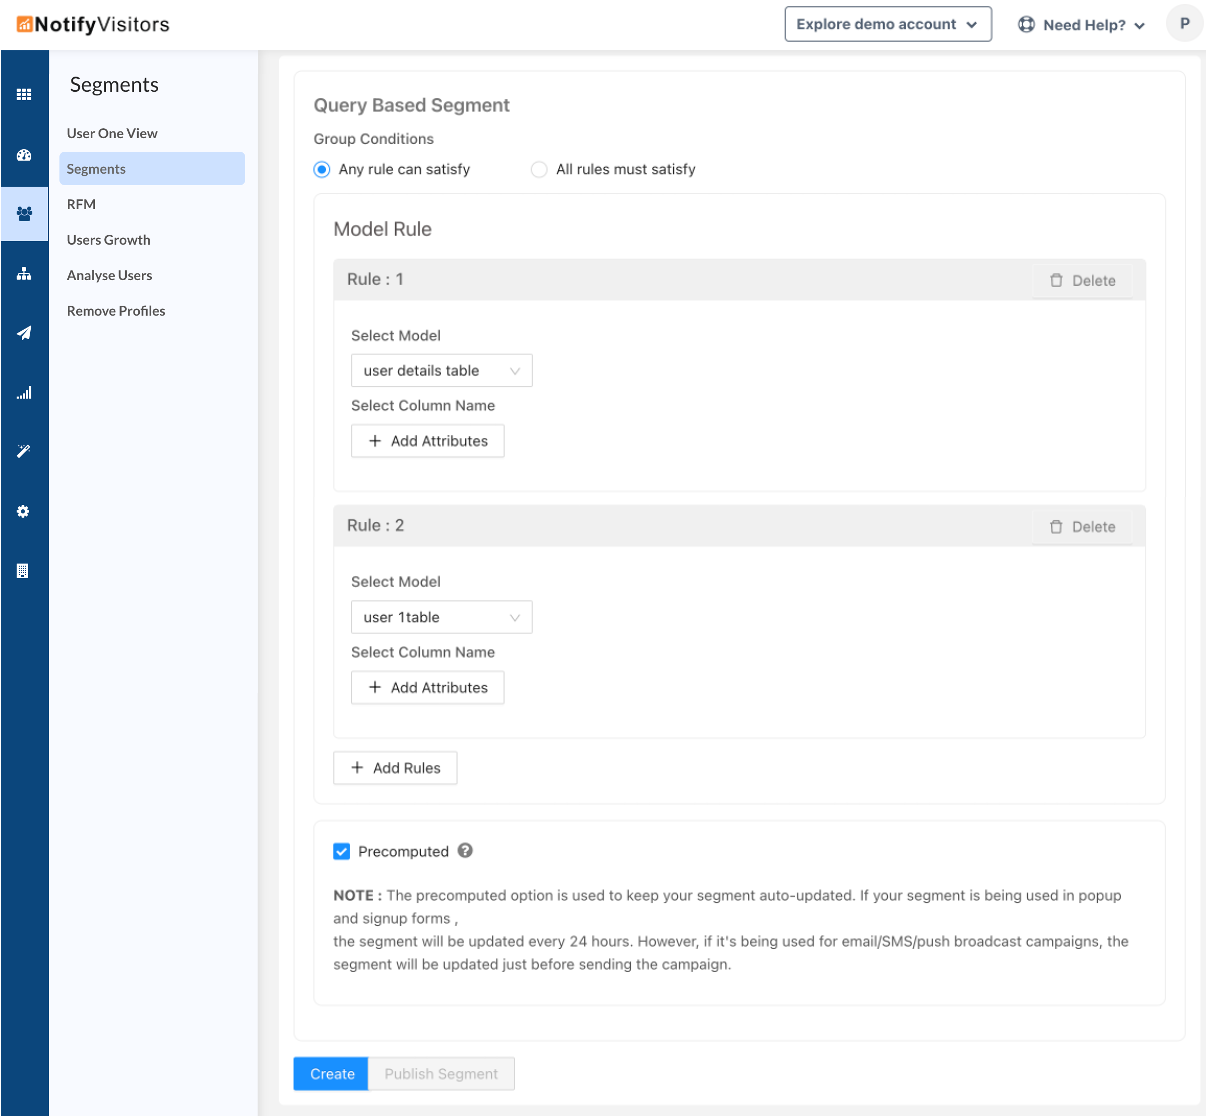
Once created such segments can be used to create personalized campaigns in NotifyVisitors.
Analyze Models
To analyze a model, head to the Analytics section of your NotifyVisitors console and choose the Analyse Models option. Here, select your preferred model, along with a date criterion (like the last login or signup date) and attribute filter to observe trends accordingly.
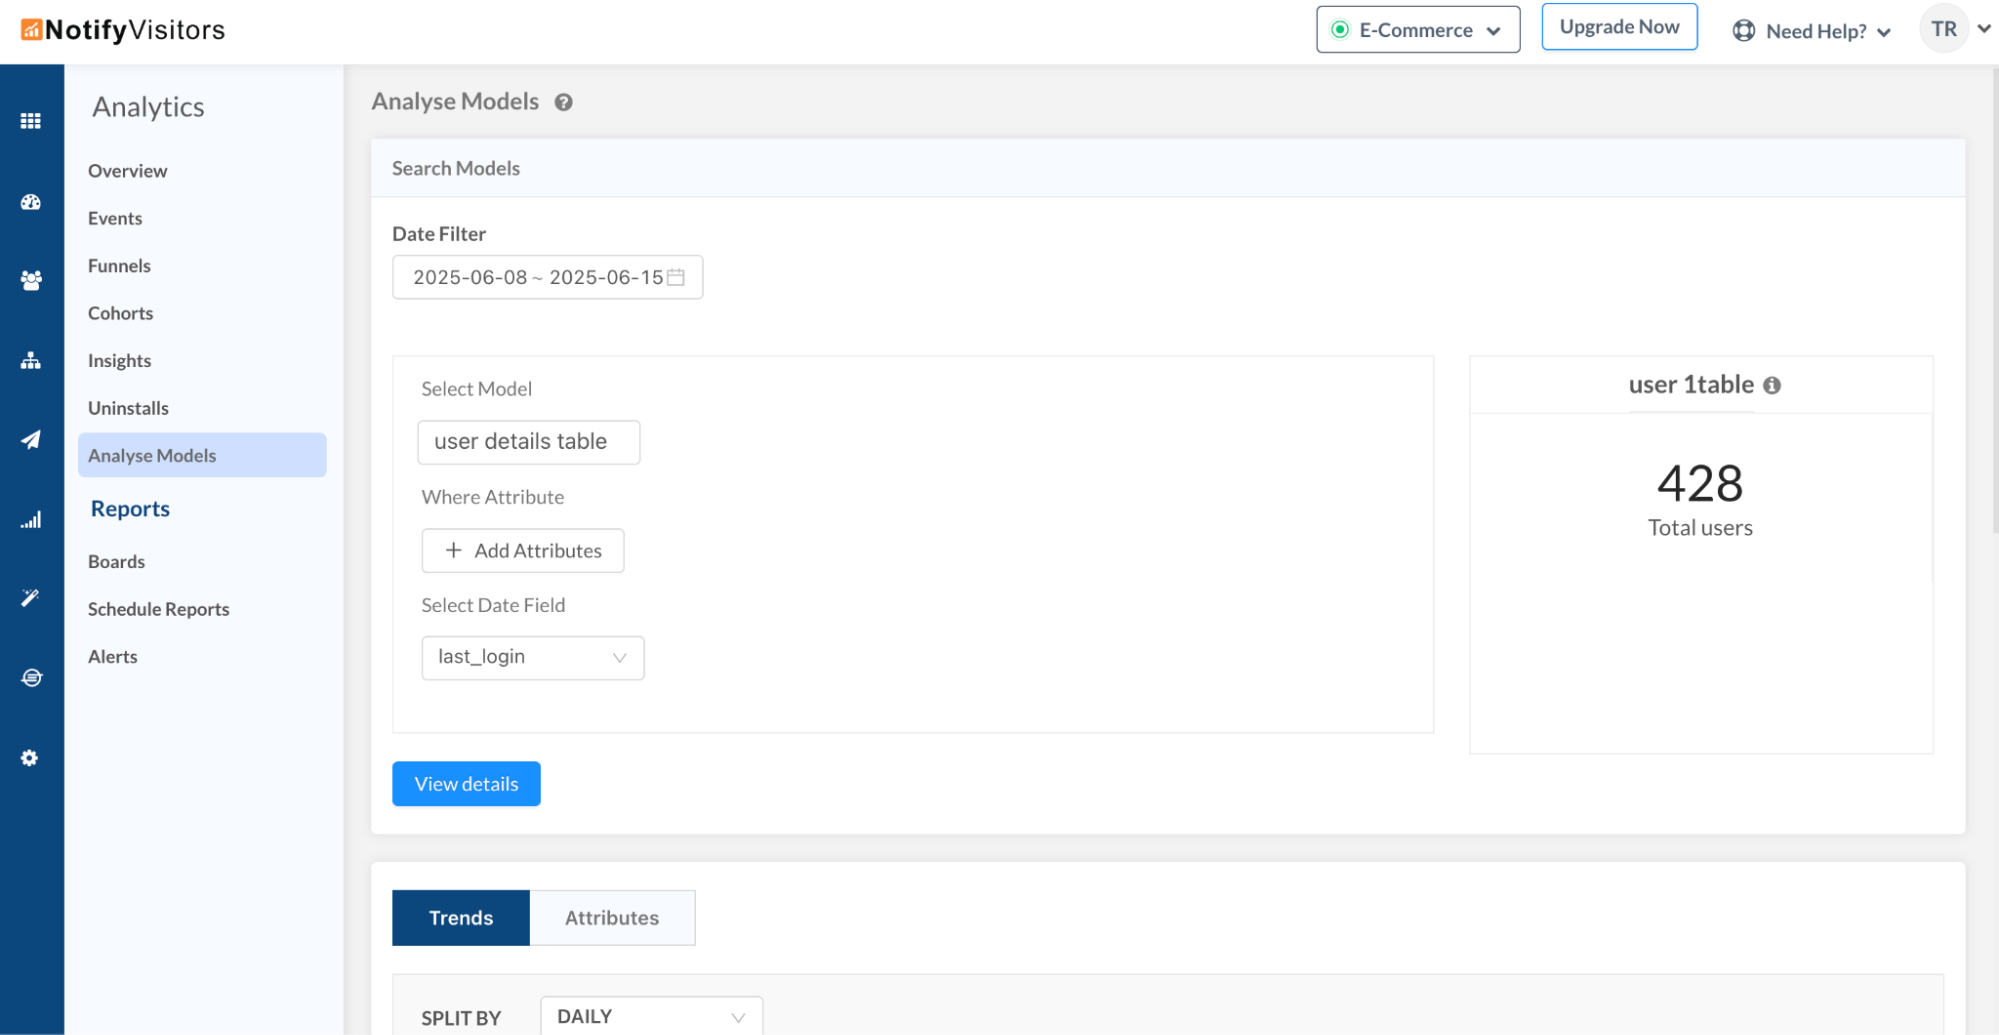
After configuration, click on View Details to see visual trends and attribute-based comparisons, helping you gain actionable insights from your data models.

At NotifyVisitors, we are constantly working to bring new features and improvements to our platform, based on the feedback and Read more

Introducing the May Release Notes – a roundup of the top upgrades and enhancements we've made to our platform this Read more

We are excited to announce a range of new features and enhancements in this month's release notes. These updates aim Read more

During this month, several significant updates have been implemented, with a primary focus on enhancing the marketing capabilities of our Read more