
 Email
Email SMS
SMS Whatsapp
 Web Push
 App Push
 Popups
 Channel A/B Testing
  Control groups Analysis
 Frequency Capping
 Funnel Analysis
 Cohort Analysis
 RFM Analysis
 Signup Forms
 Surveys
 NPS
NPS Landing pages personalization
  Website A/B Testing
  PWA/TWA
 Heatmaps
 Session Recording
 Wix
Wix Shopify
 Magento
 Woocommerce
 eCommerce D2C
  Mutual Funds
 Insurance
 Lending
  Recipes
  Product Updates
 App Marketplace
 Academy


A heat map, being mere a cool colorful tool can do more than what you have ever thought of! In this article, we will read a heatmap case study on how Aditya Birla Increased their Sign Up.
Aditya Birla Capital Limited (ABCL) is one of the largest players in the financial services sector in India.
Formerly known as Aditya Birla Financial Services Limited. ABCL is the holding company of all the financial services businesses of the Aditya Birla Group. ABCL is committed to serving the end-to-end financial services needs of its retail and corporate customers under a unified brand.
About the Client
- Client Name: Aditya Birla Capital
- Client Website: https://adityabirlacapital.com
- Headquarters: Mumbai, India
- About the client: Aditya Birla Capital Limited (ABCL) is one of the largest financial services players in India.
Goals
- Increase new signup on the website
Approach
- Implemented NotifyVisitors HeatMap to understand the highly activated position of the existing Login page/ Signup.
- HeatMap represents user’s sessions visiting the website and areas where users are clicking on the website. The analysis is executed to understand which section performed better in terms of user engagement moving to next.
Challenge
Aditya Birla Capital (ABC) was in the process of changing some elements and UI on their website. The primary aspect was to understand user behavior and increase CTA clicks. In order to identify this, they decided to measure the clicks garnered by the sections and categories of the page.
This enabled them to determine the major attraction for the users to navigate on the website.
Approach to the Solution
ABC has been using NotifyVisitors for one year now. NotifyVisitors collected all the required data using comprehensive tracking to understand user behavior.
NotifyVisitors suggested HeatMap Solution to ABC that would successfully address their pain points related to page-level user behavior.
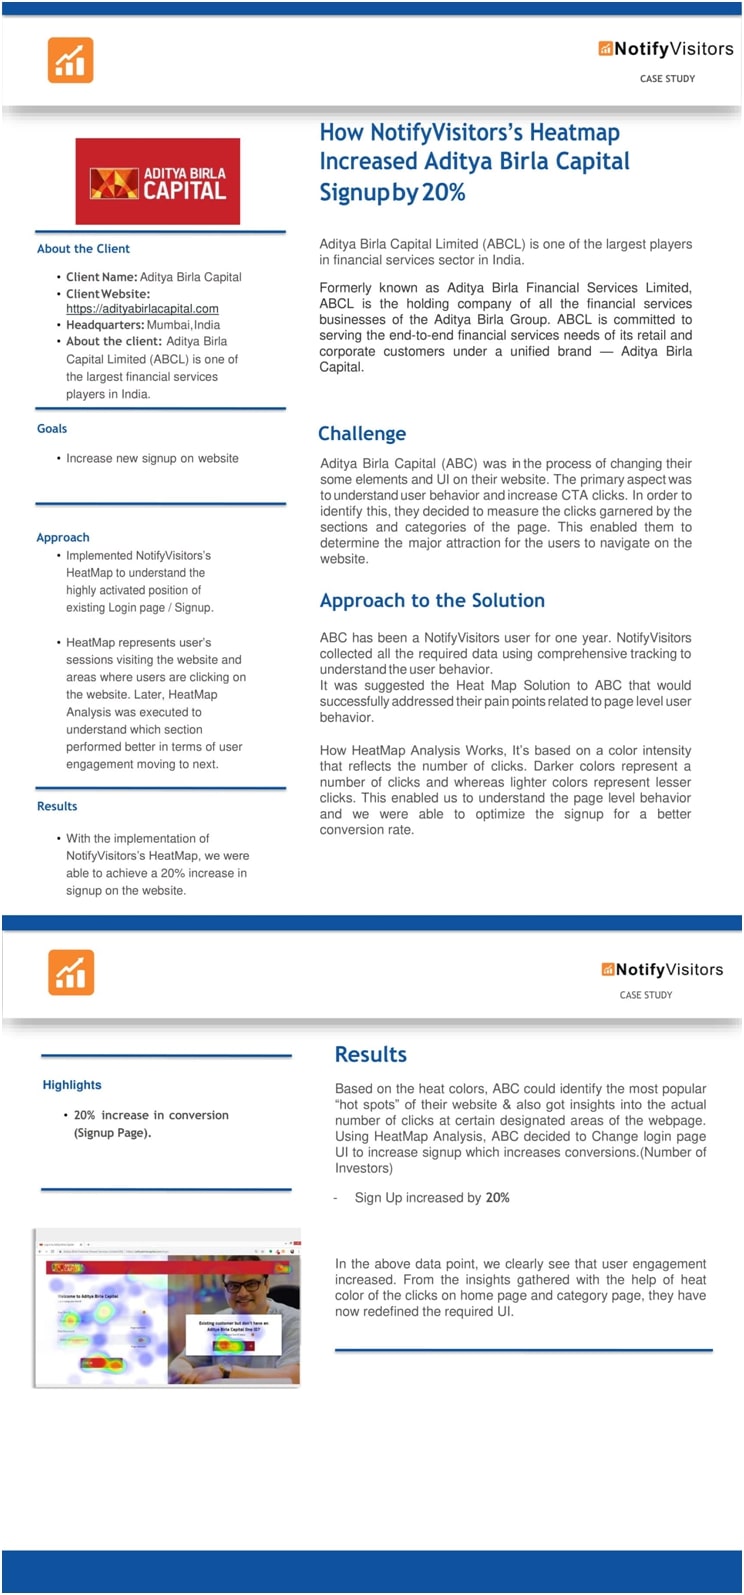
How HeatMap Analysis Works, It’s based on a color intensity that reflects the number of clicks. Darker colors represent a number of clicks and whereas lighter colors represent lesser clicks.
This enabled us to understand the page level behavior and we were able to optimize the signup for a better conversion rate.
Results
- With the implementation of NotifyVisitors’s HeatMap, we were able to achieve a 20% increase in signup on the website.
Results
Based on the heat colors, ABC could identify the most popular “hot spots” of their website. Also, got insights into the actual number of clicks at certain designated areas of the webpage.
Using HeatMap Analysis, ABC decided to Change login page UI to increase signup which increases conversions. (Number of Investors)
Sign Up increased by 20%
In the above data point, we clearly see that user engagement increased. From the insights gathered with the help of heat color of the clicks on the home page and category page, they have now redefined the required UI.

Highlights
20% increase in conversion (Signup Page)
⇨ Download the Printable Version ⇦
Conclusion:
Hope this heatmap case study on Aditya Birla was a help to you. And now you consider implementing the heatmaps to your webpage too.
Siddharth
QUICK LINKS


