
 Email
Email SMS
SMS Whatsapp
 Web Push
 App Push
 Popups
 Channel A/B Testing
  Control groups Analysis
 Frequency Capping
 Funnel Analysis
 Cohort Analysis
 RFM Analysis
 Signup Forms
 Surveys
 NPS
NPS Landing pages personalization
  Website A/B Testing
  PWA/TWA
 Heatmaps
 Session Recording
 Wix
Wix Shopify
 Magento
 Woocommerce
 eCommerce D2C
  Mutual Funds
 Insurance
 Lending
  Recipes
  Product Updates
 App Marketplace
 Academy
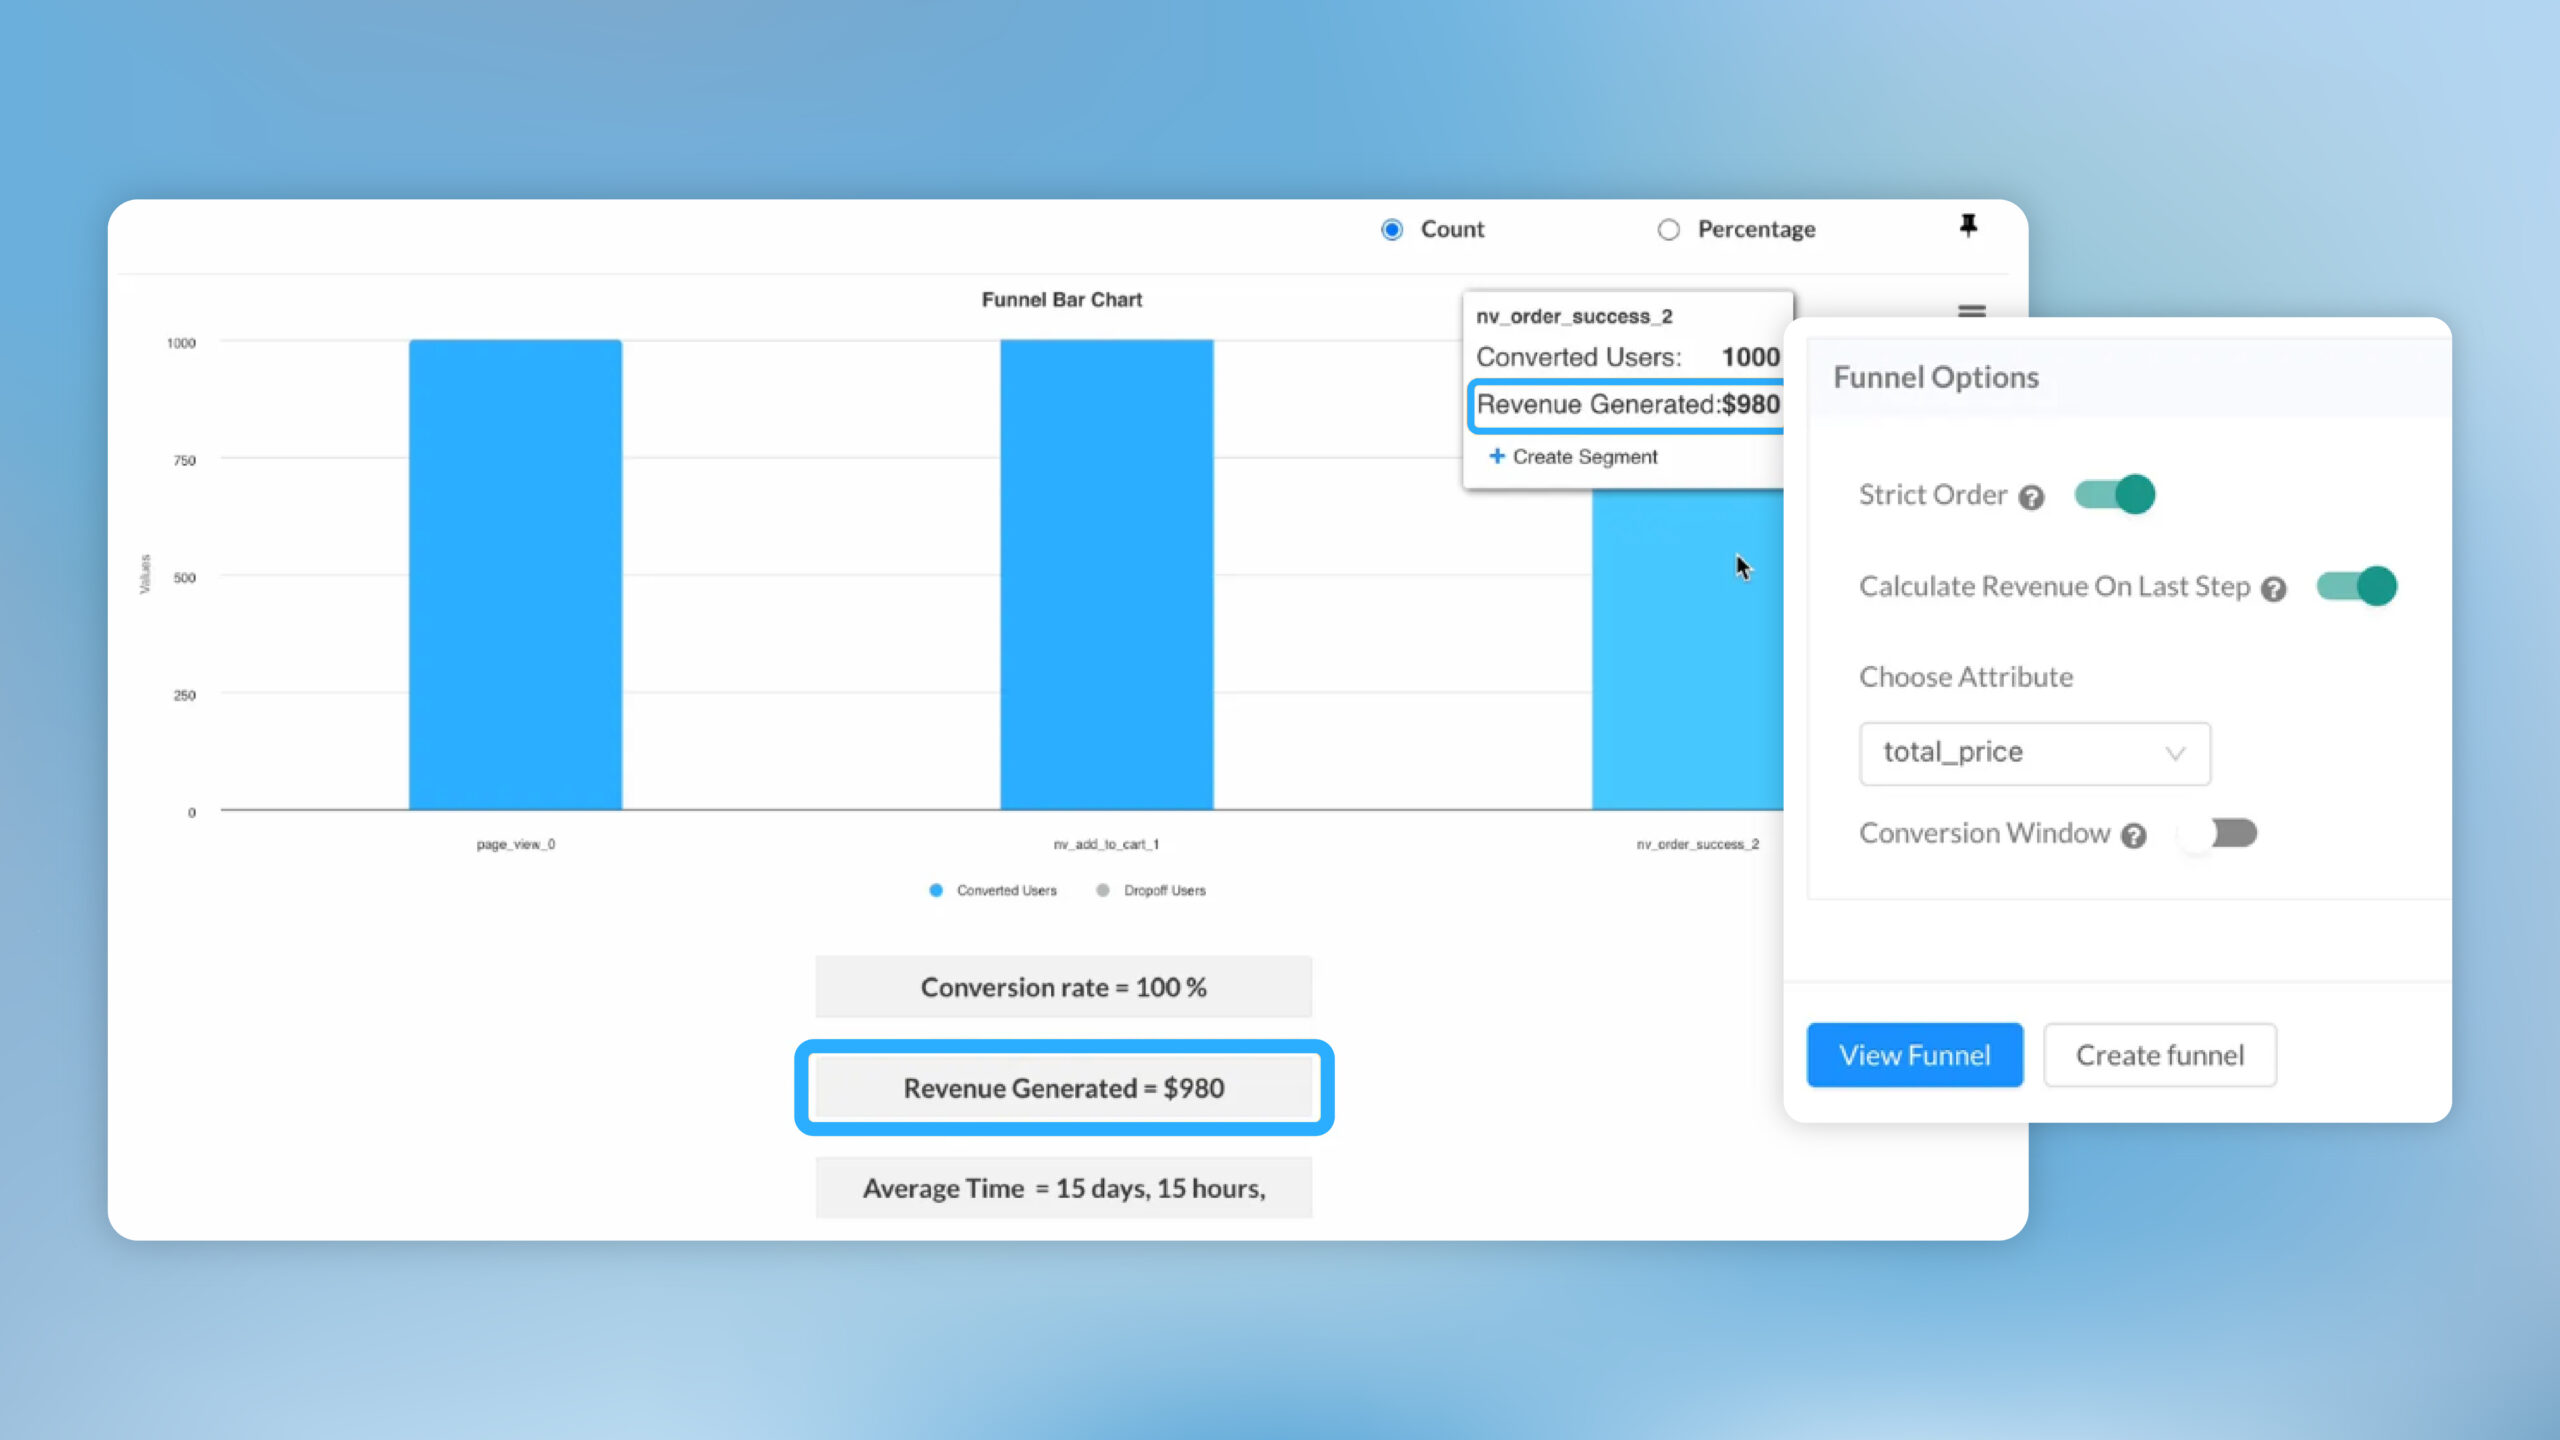
We’ve introduced two major enhancements to Funnels.
1. Calculate Revenue on Last Step
Funnels already tell you how many users make it through each stage. This update adds the missing business context, how much revenue is generated at the final step (e.g., Order Placed). Now you can evaluate conversion and commercial impact in the same view.
How to use it
- Open Analytics → Funnels and click Create / Edit on your funnel.
- Scroll down to the Funnel Options and enable Calculate revenue on last step.
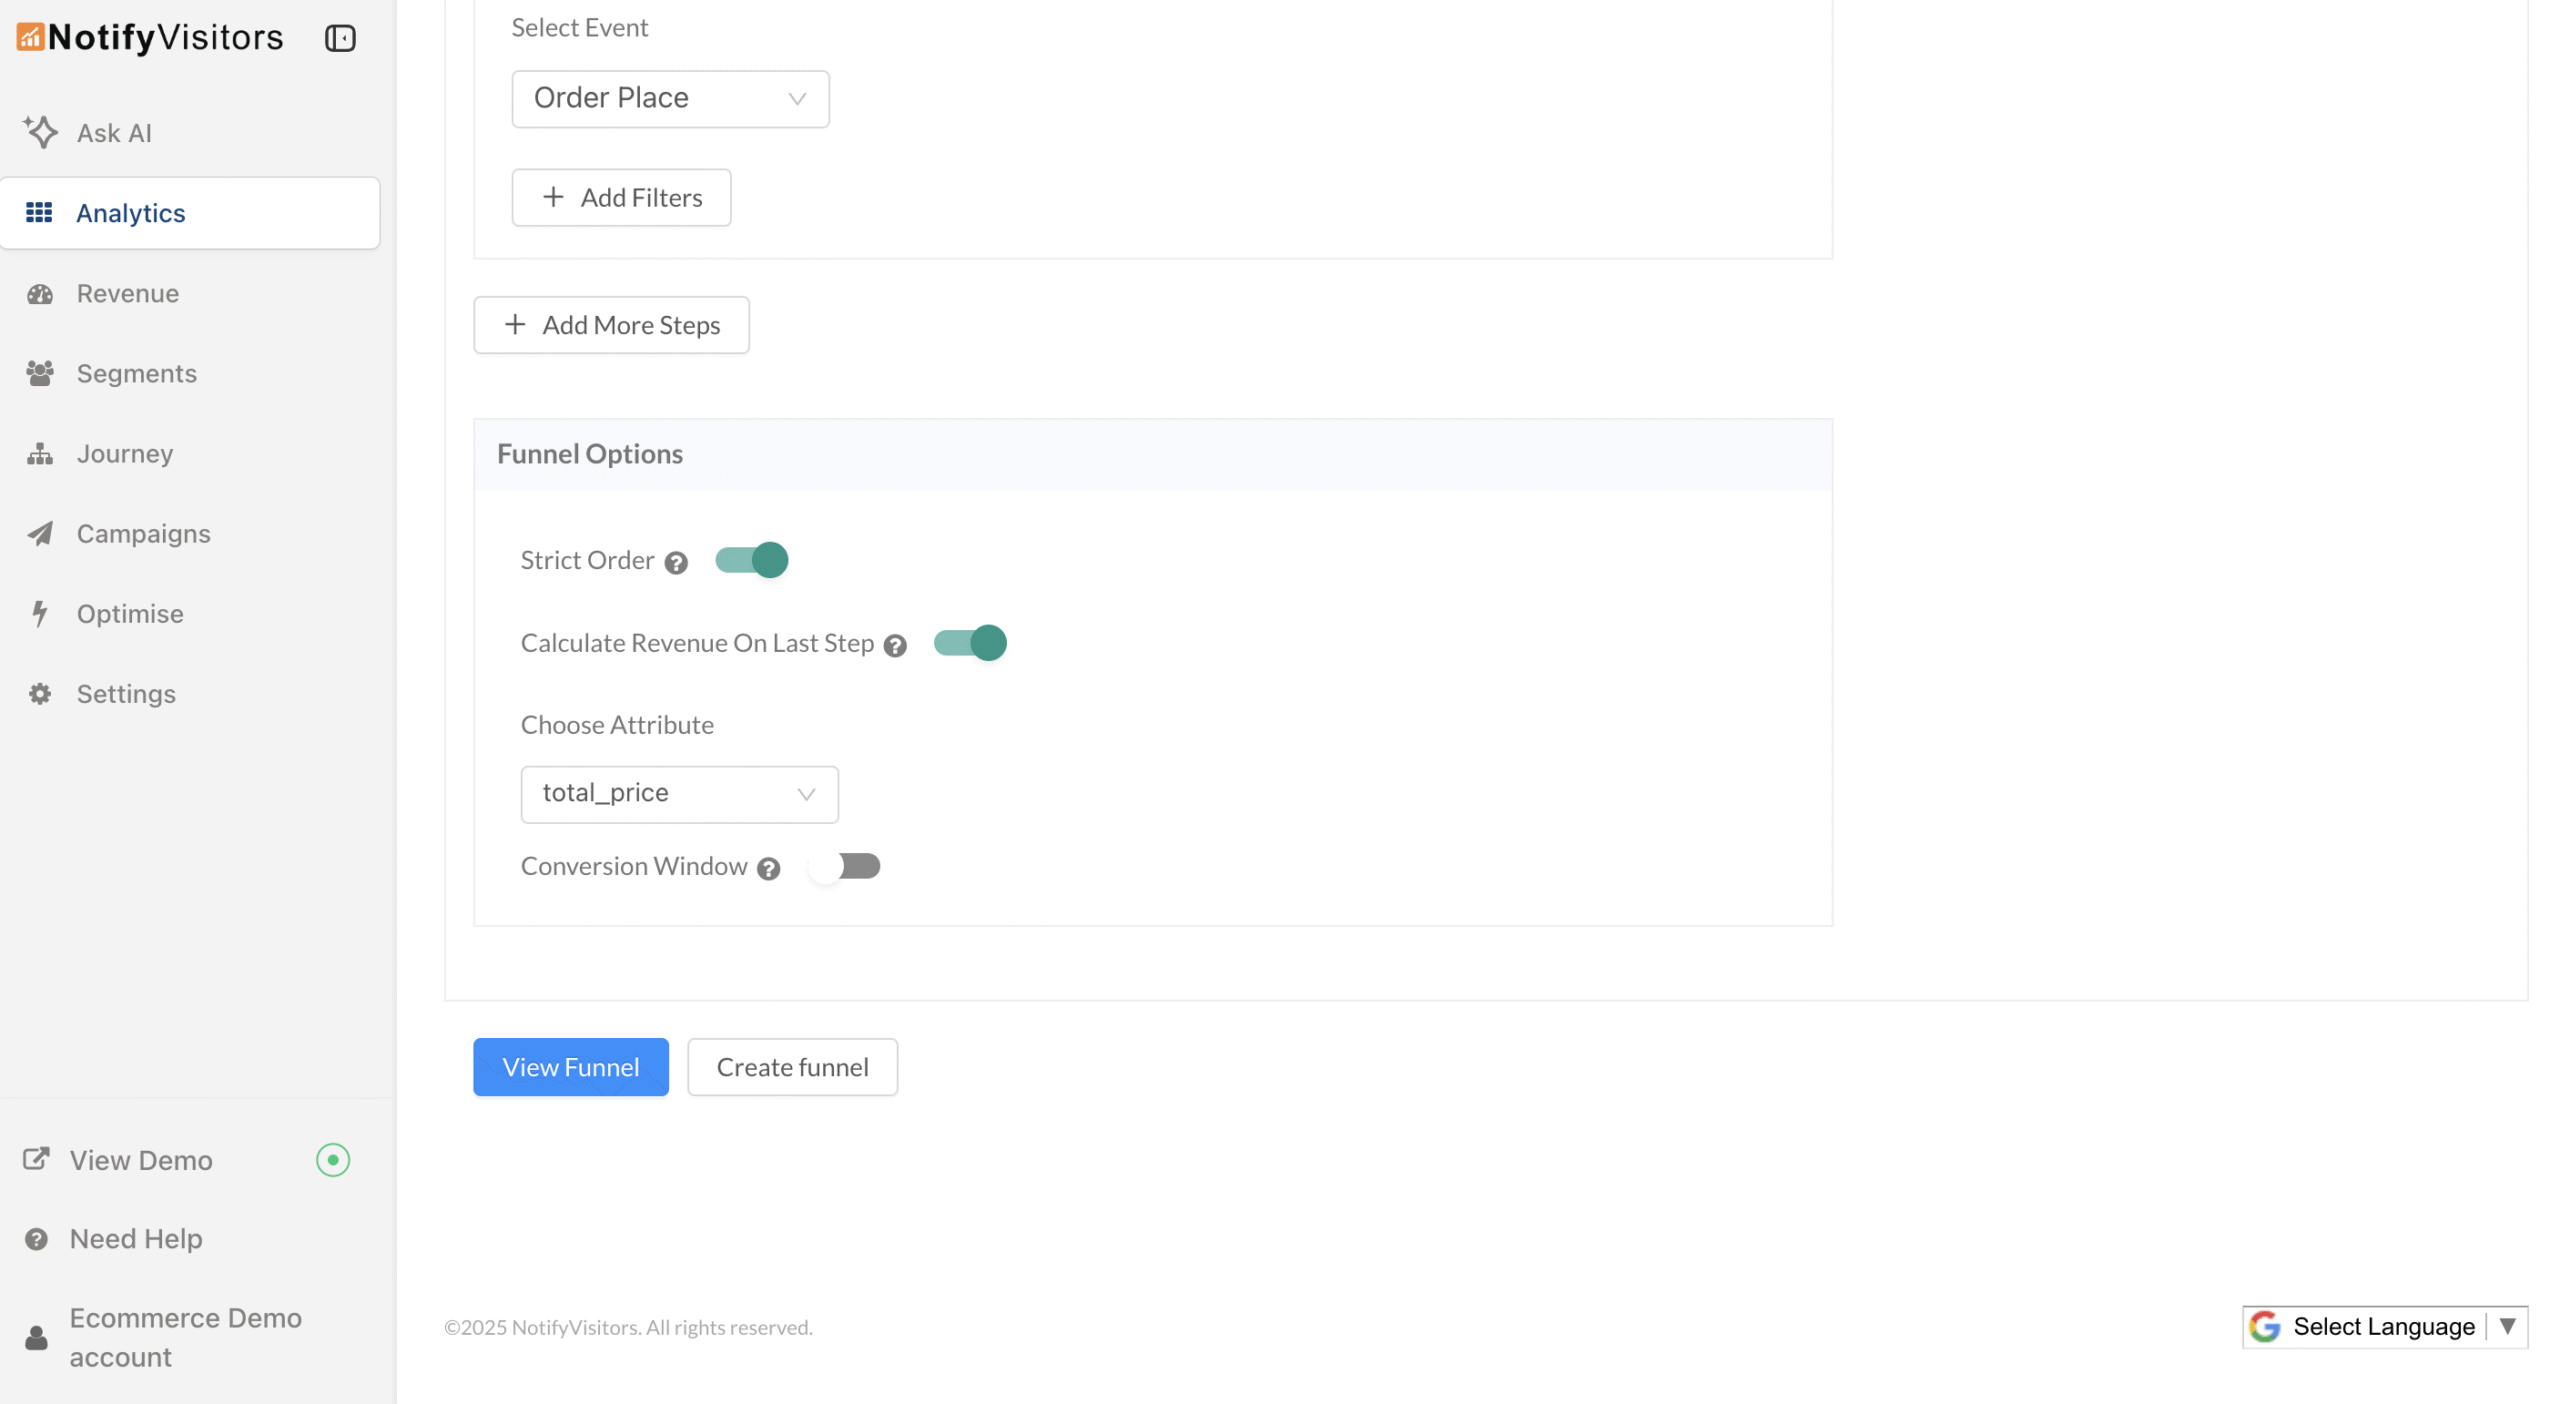
- In Choose Attribute, select your revenue field (e.g. total_price) and click View Funnel.
- Review the Revenue Generated figure beneath the chart or hover the last step bar to see revenue for that step alongside converted users.
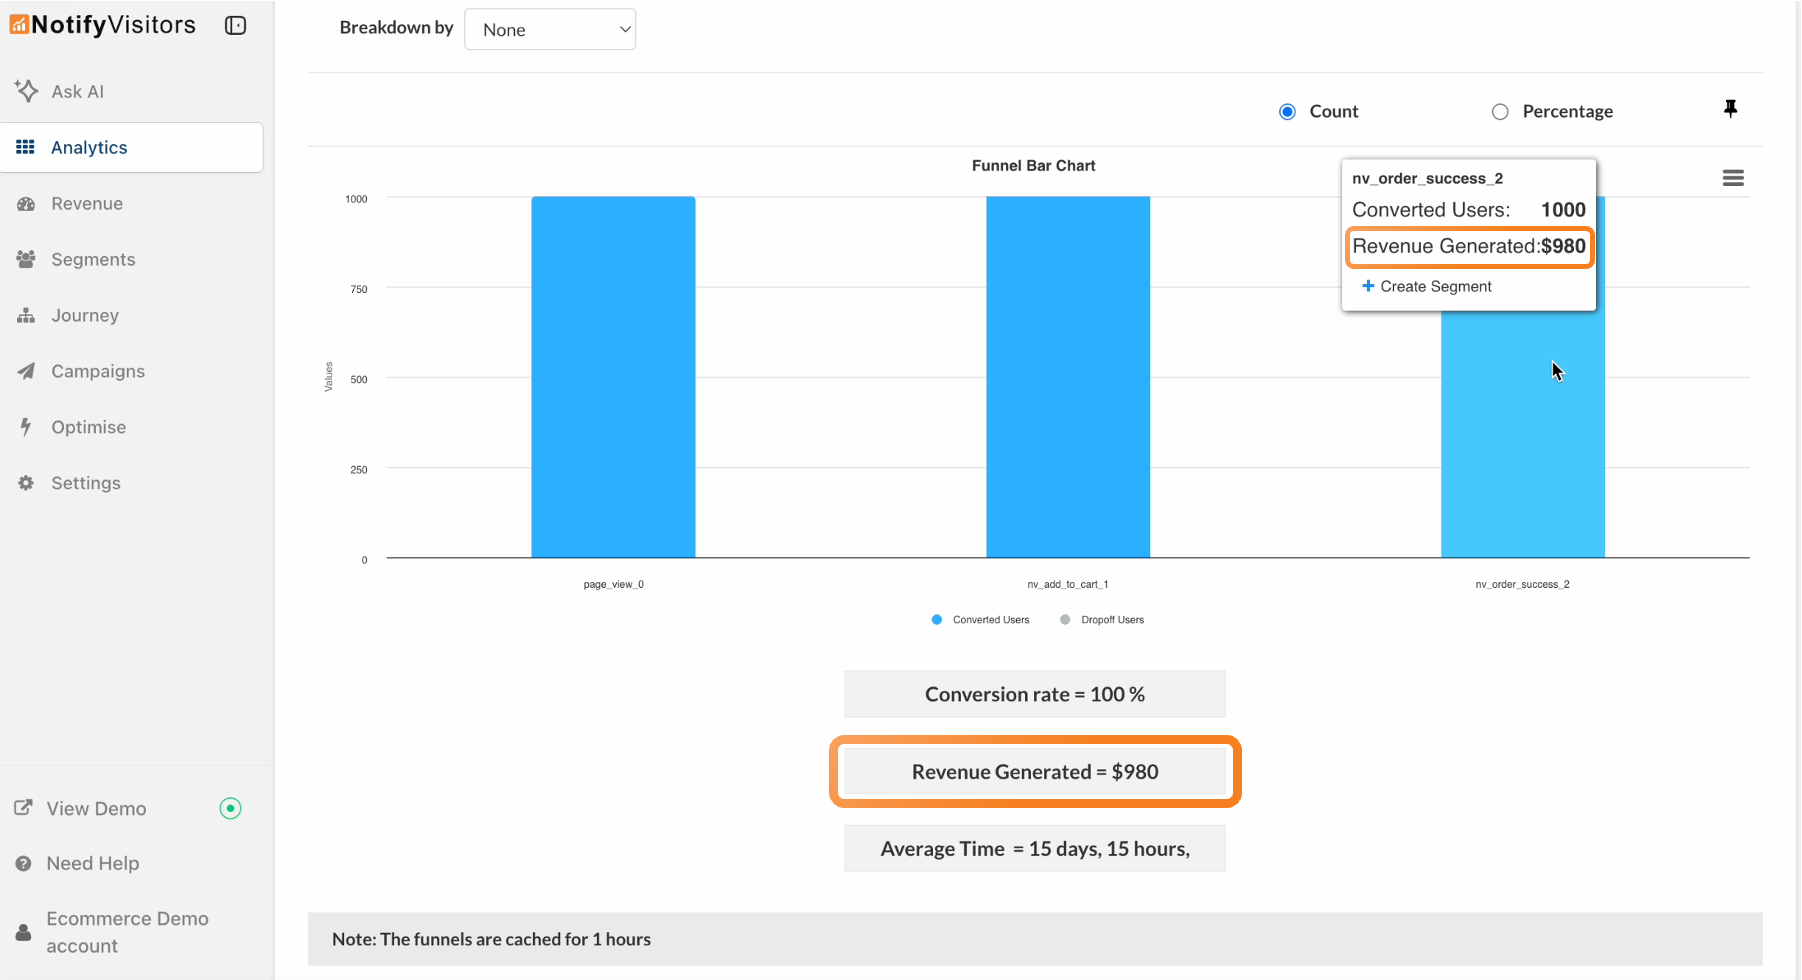
This makes it easy to measure ROI, compare funnels, and spot revenue-impacting bottlenecks instantly in one place.
2. Conversion Window — Count Only Timely Conversions
Not all conversions are equal. Some funnel steps (like: add-to-cart → purchase, signup → first deposit, trial start → paid) should convert within a tight window. The Conversion Window lets you include only those users who enter the funnel and complete the final step within a time limit you set—so your funnel metrics reflect timely, high-intent conversions, not long-tail stragglers.
What’s new & how it helps
Problem: Traditional funnels count a user as “converted” even if they take days or weeks to finish—making fast journeys look healthier than they really are and masking issues that require quick action.
Solution: With Conversion Window enabled, a user is counted only if they perform the first step and the last step within your defined window. Example: set Conversion Window as 1 day—only users who start the funnel and finish within 24 hours are included. Your date filter continues to work as usual; e.g., with a monthly date range selected, only users who completed within 24 hours and within that month are counted. This gives you cleaner, time-bound conversion rates for diagnosing friction, comparing campaigns, and measuring true funnel velocity.
How to use it
- Open your funnel and scroll to Funnel Options.
- Toggle Conversion Window → choose minutes/hours/days and set the value.
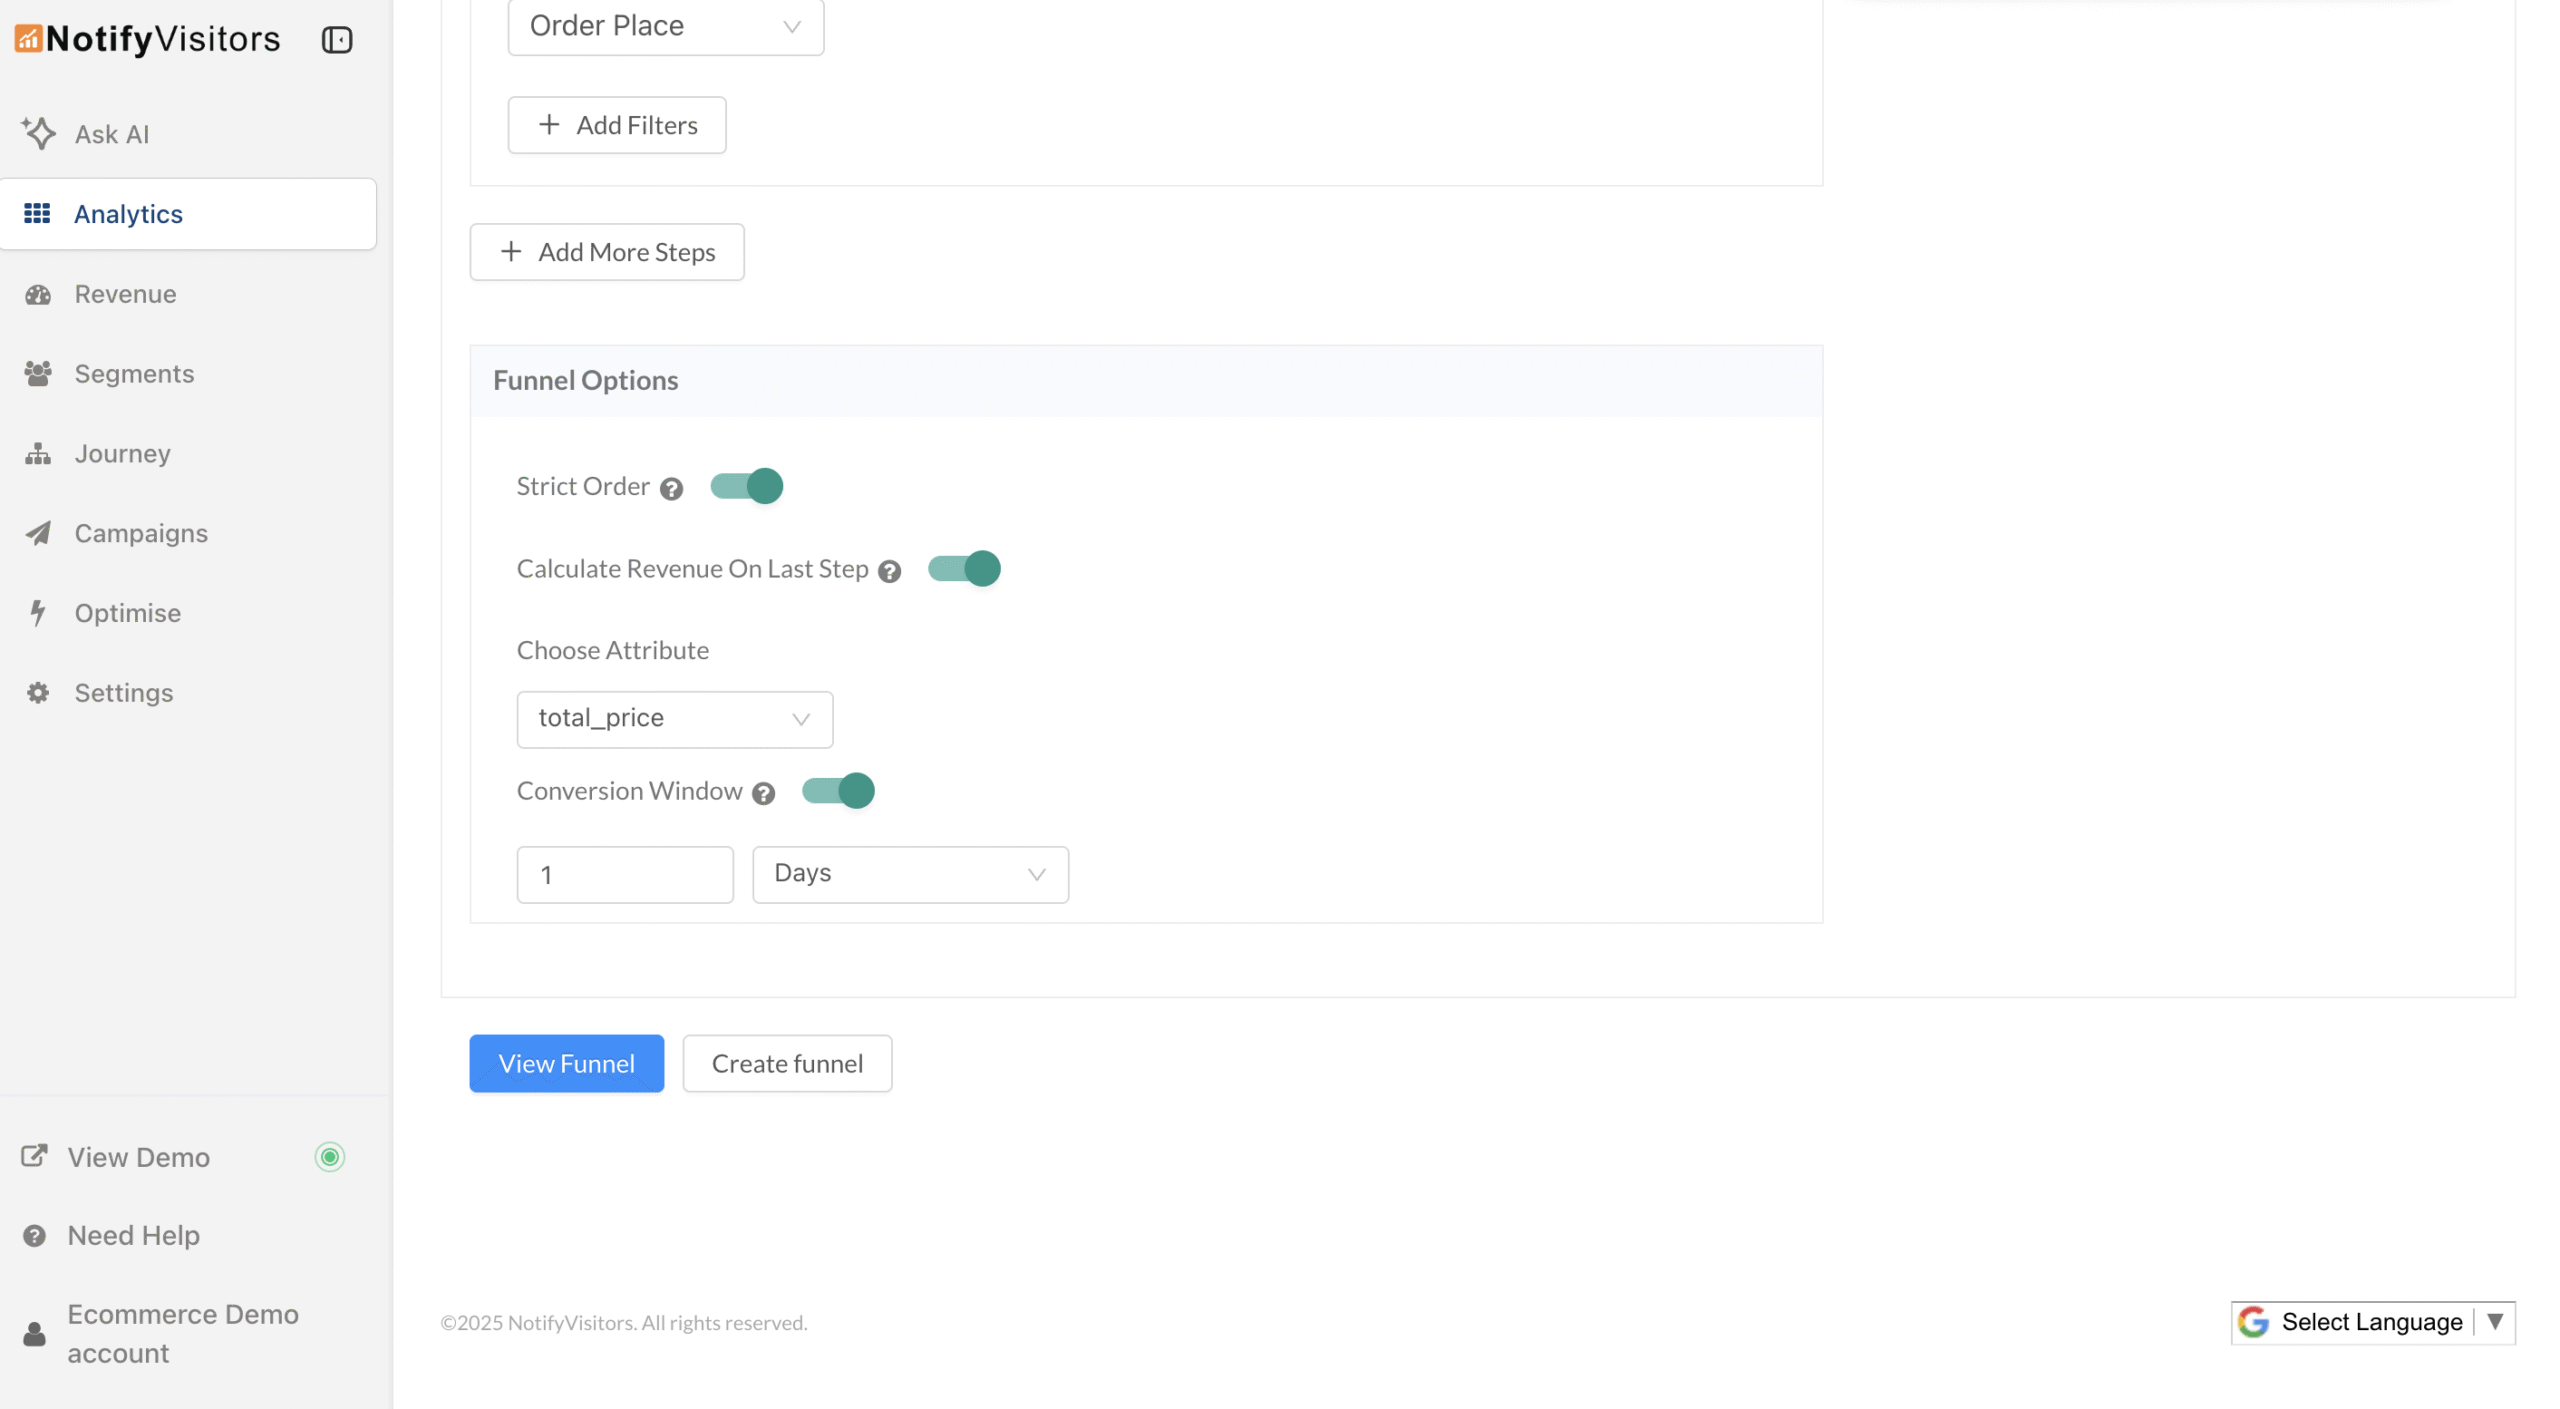
- Click View Funnel to update the chart and stats.
- Use alongside other funnel options (e.g., strict order, breakdowns) to pinpoint where time-sensitive users drop off.
The Conversion Window keeps your funnel honest, counting only the conversions that happen within the time frame that actually matters to your business.

Welcome to our latest release notes! This month, we're excited to introduce four exciting features: WhatsApp URL Tracking, Private WhatsApp Read more

Welcome to our latest release notes! This month, we are excited to introduce several new features and enhancements for catalog Read more

The new "session_start" system event enhances user session tracking by triggering every time a user visits your website, with sessions Read more

New trend options in Events Analytics allow deeper analysis of event property aggregate values, including sum, average, minimum, maximum, median, Read more