 Email
Email SMS
SMS Whatsapp
 Web Push
 App Push
 Popups
 Channel A/B Testing
  Control groups Analysis
 Frequency Capping
 Funnel Analysis
 Cohort Analysis
 RFM Analysis
 Signup Forms
 Surveys
 NPS
NPS Landing pages personalization
  Website A/B Testing
  PWA/TWA
 Heatmaps
 Session Recording
 Wix
Wix Shopify
 Magento
 Woocommerce
 eCommerce D2C
  Mutual Funds
 Insurance
 Lending
  Recipes
  Product Updates
 App Marketplace
 Academy
Added the Redirection Option in Custom Board Cards
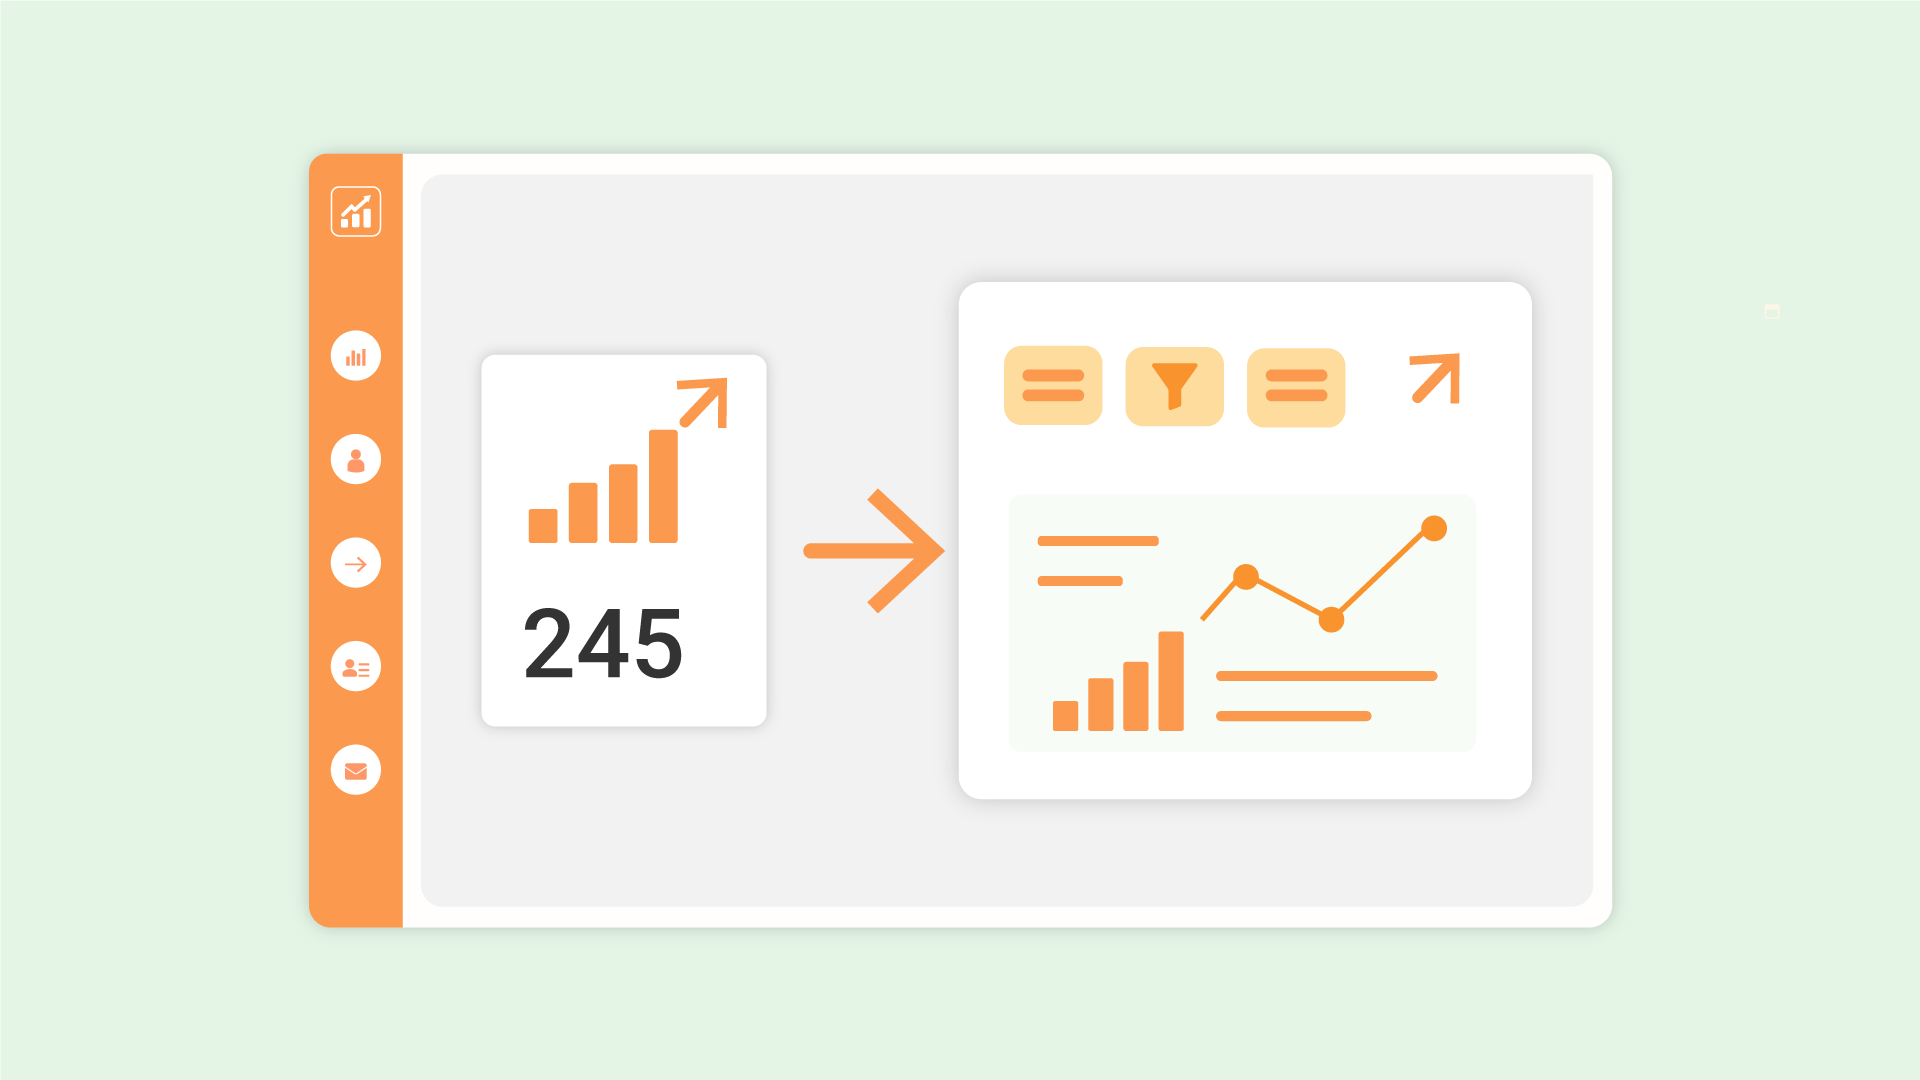
Custom board cards now include a redirect icon that takes you straight to the full analytics report with the same events and filters pre-applied. It helps teammates jump into the detailed view quickly for deeper analysis or quick adjustments.