
 Email
Email SMS
SMS Whatsapp
 Web Push
 App Push
 Popups
 Channel A/B Testing
  Control groups Analysis
 Frequency Capping
 Funnel Analysis
 Cohort Analysis
 RFM Analysis
 Signup Forms
 Surveys
 NPS
NPS Landing pages personalization
  Website A/B Testing
  PWA/TWA
 Heatmaps
 Session Recording
 Wix
Wix Shopify
 Magento
 Woocommerce
 eCommerce D2C
  Mutual Funds
 Insurance
 Lending
  Recipes
  Product Updates
 App Marketplace
 Academy
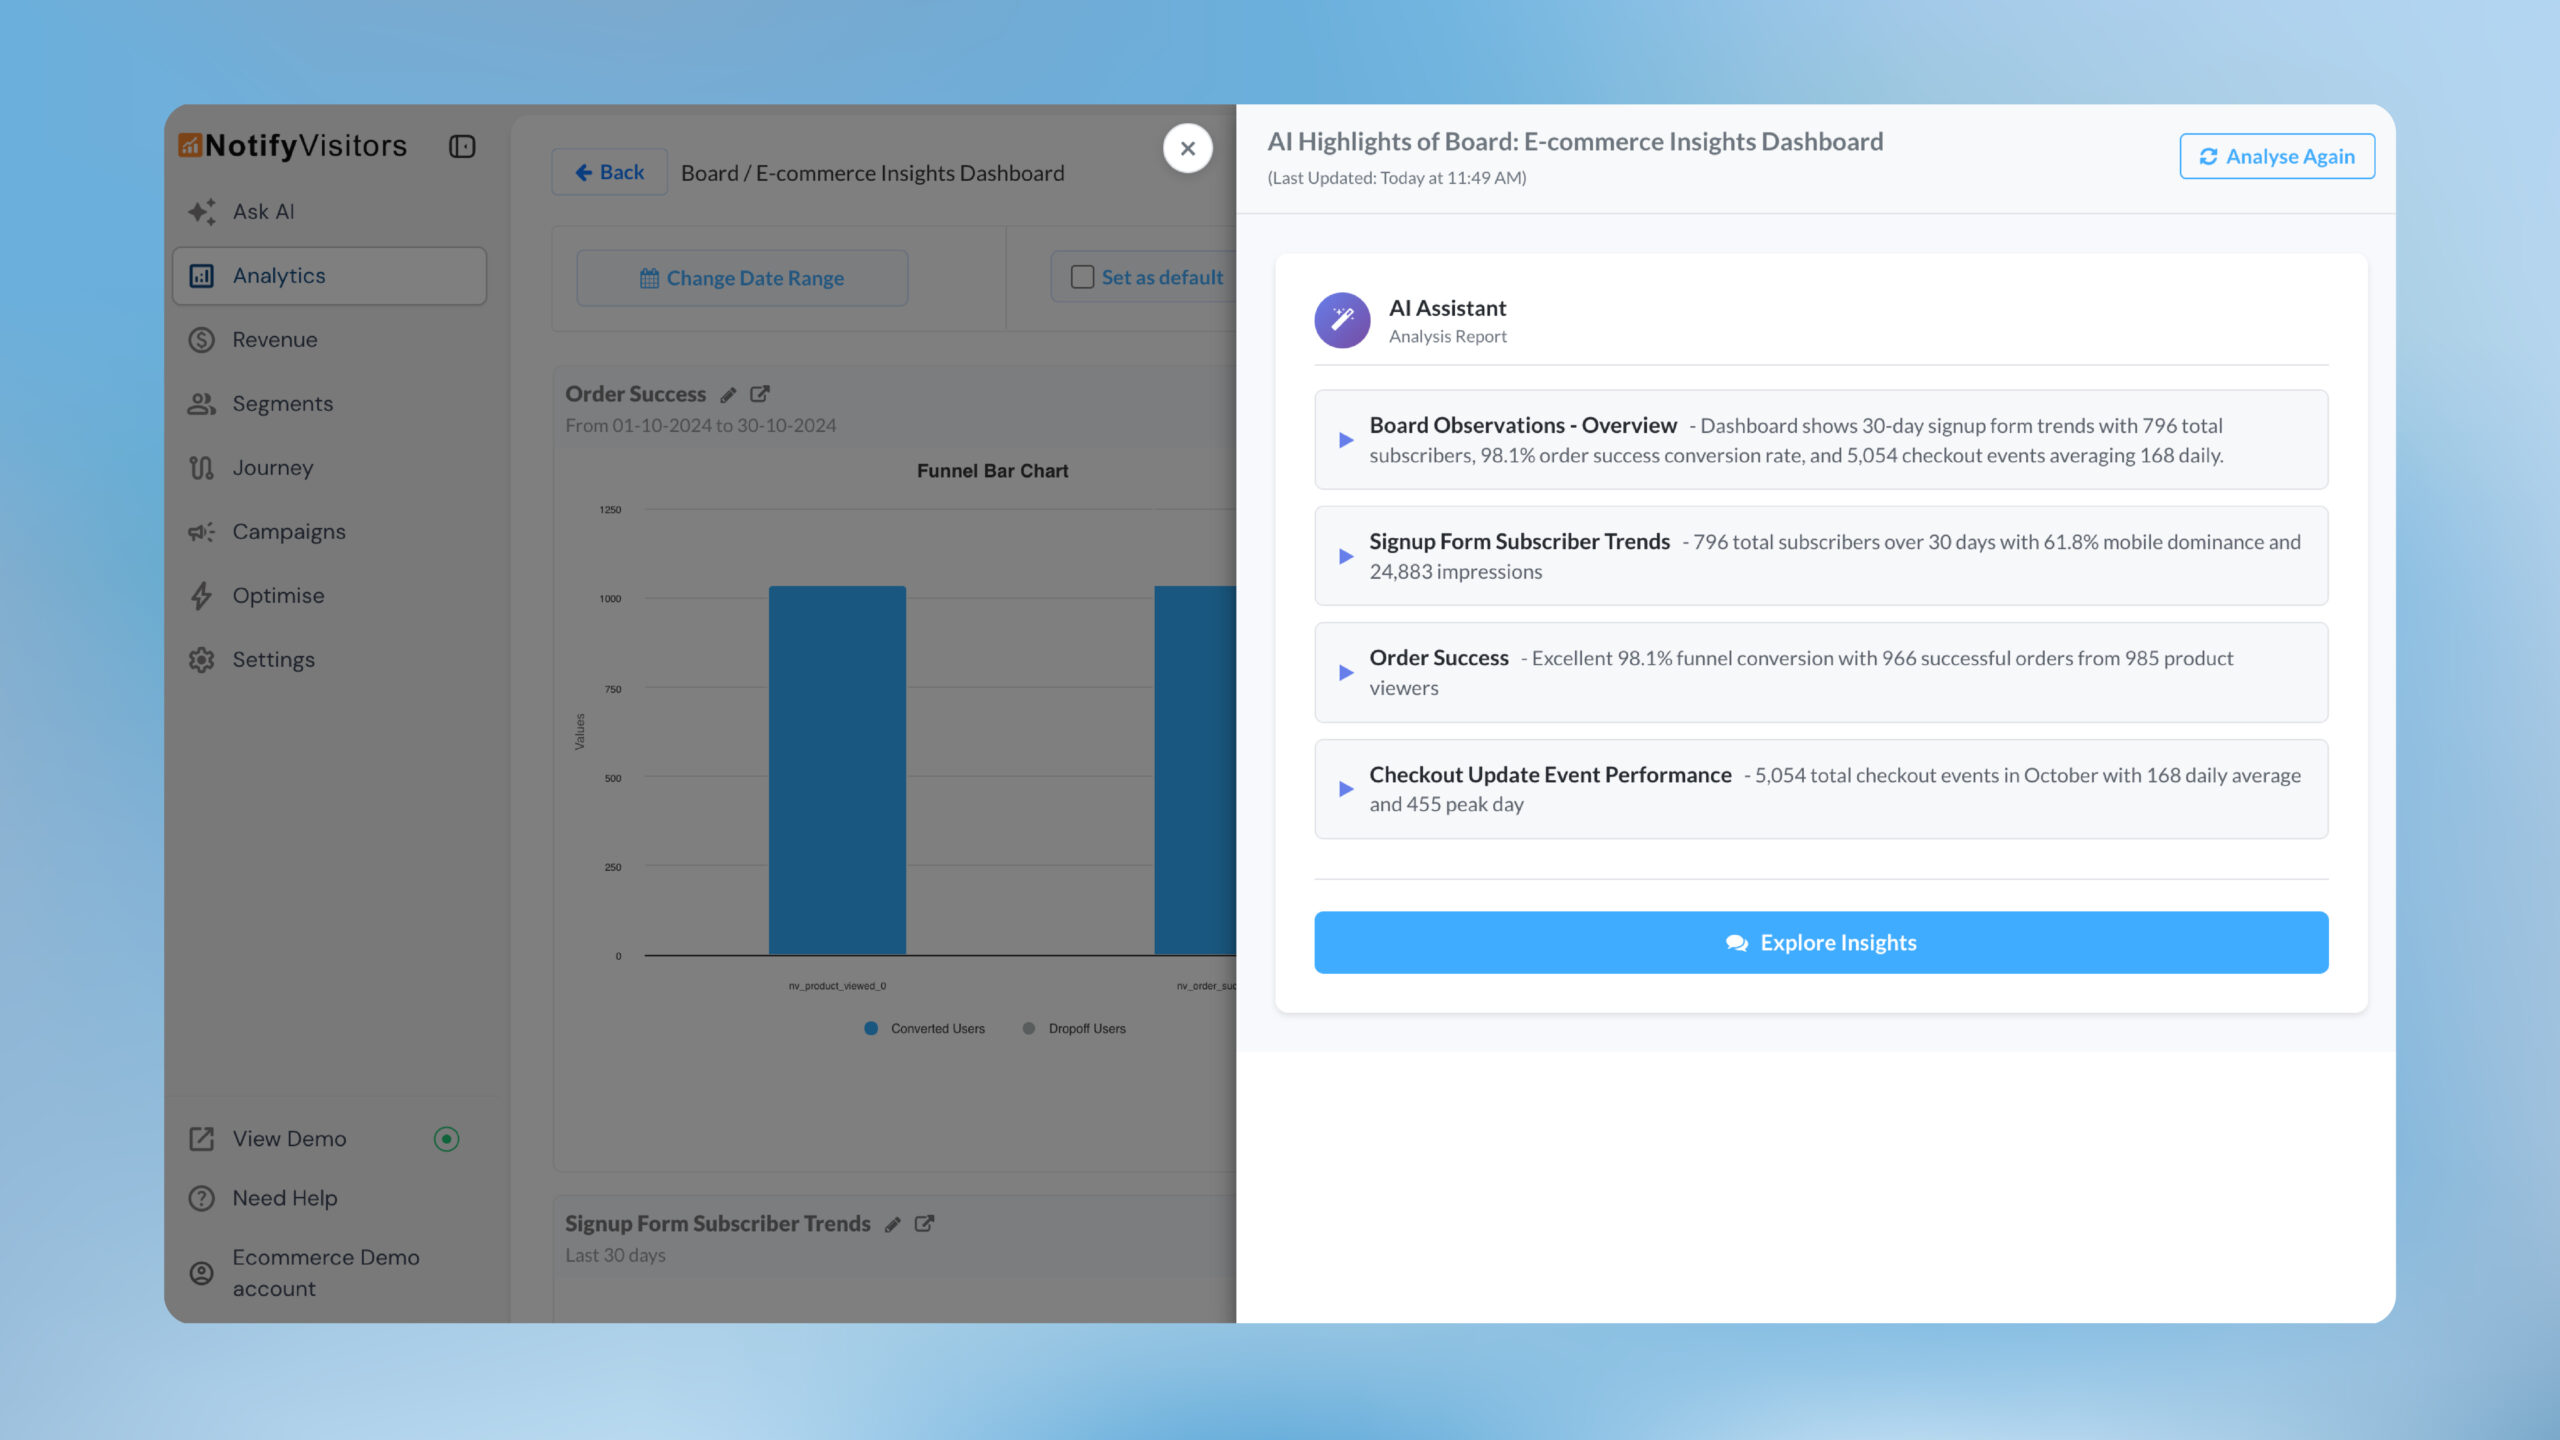
NVecta introduces AI Highlights for custom analytics boards, giving you plain-language summary of your board and its pinned reports. It helps teams quickly understand trends, anomalies, and key insights without manually reviewing every chart. Teams can also ask follow-up or cross-report questions using the AI copilot to explore specific insights in more detail.
Where to find it
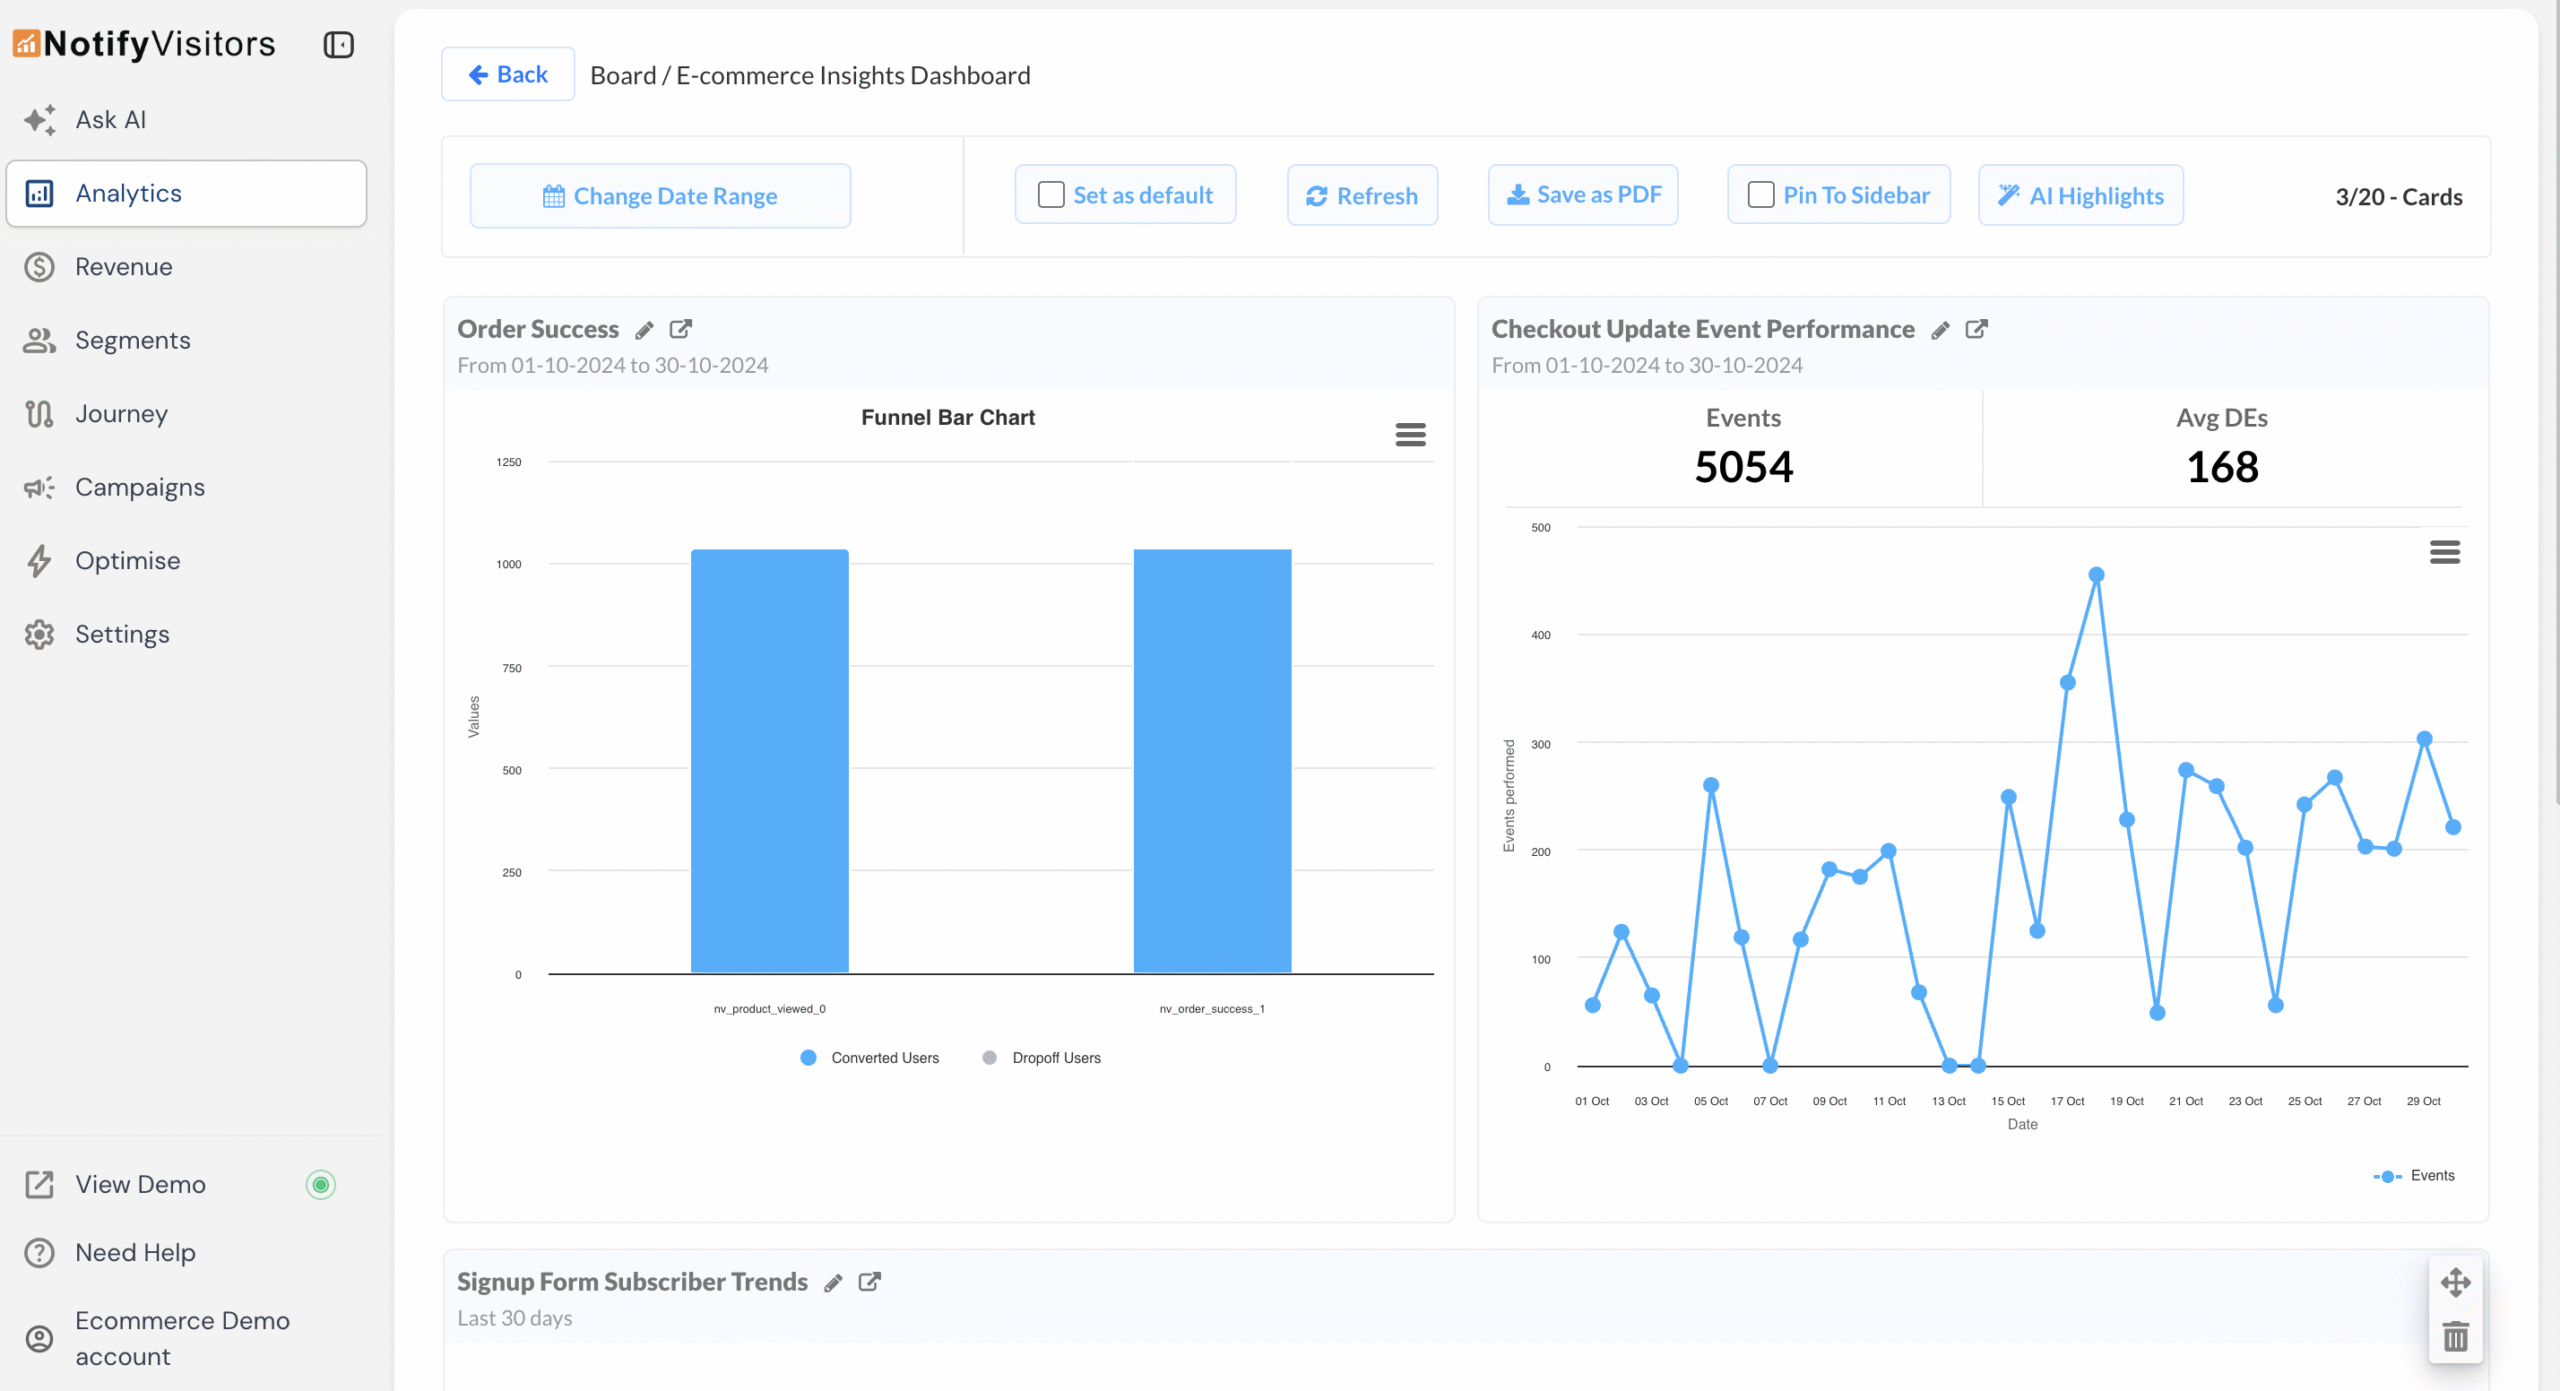
Go to Analytics → Boards. Open any custom board, then click AI Highlights button in the board toolbar (shown in image below).
The panel appears on the right with collapsible sections for board overview plus for each pinned chart.
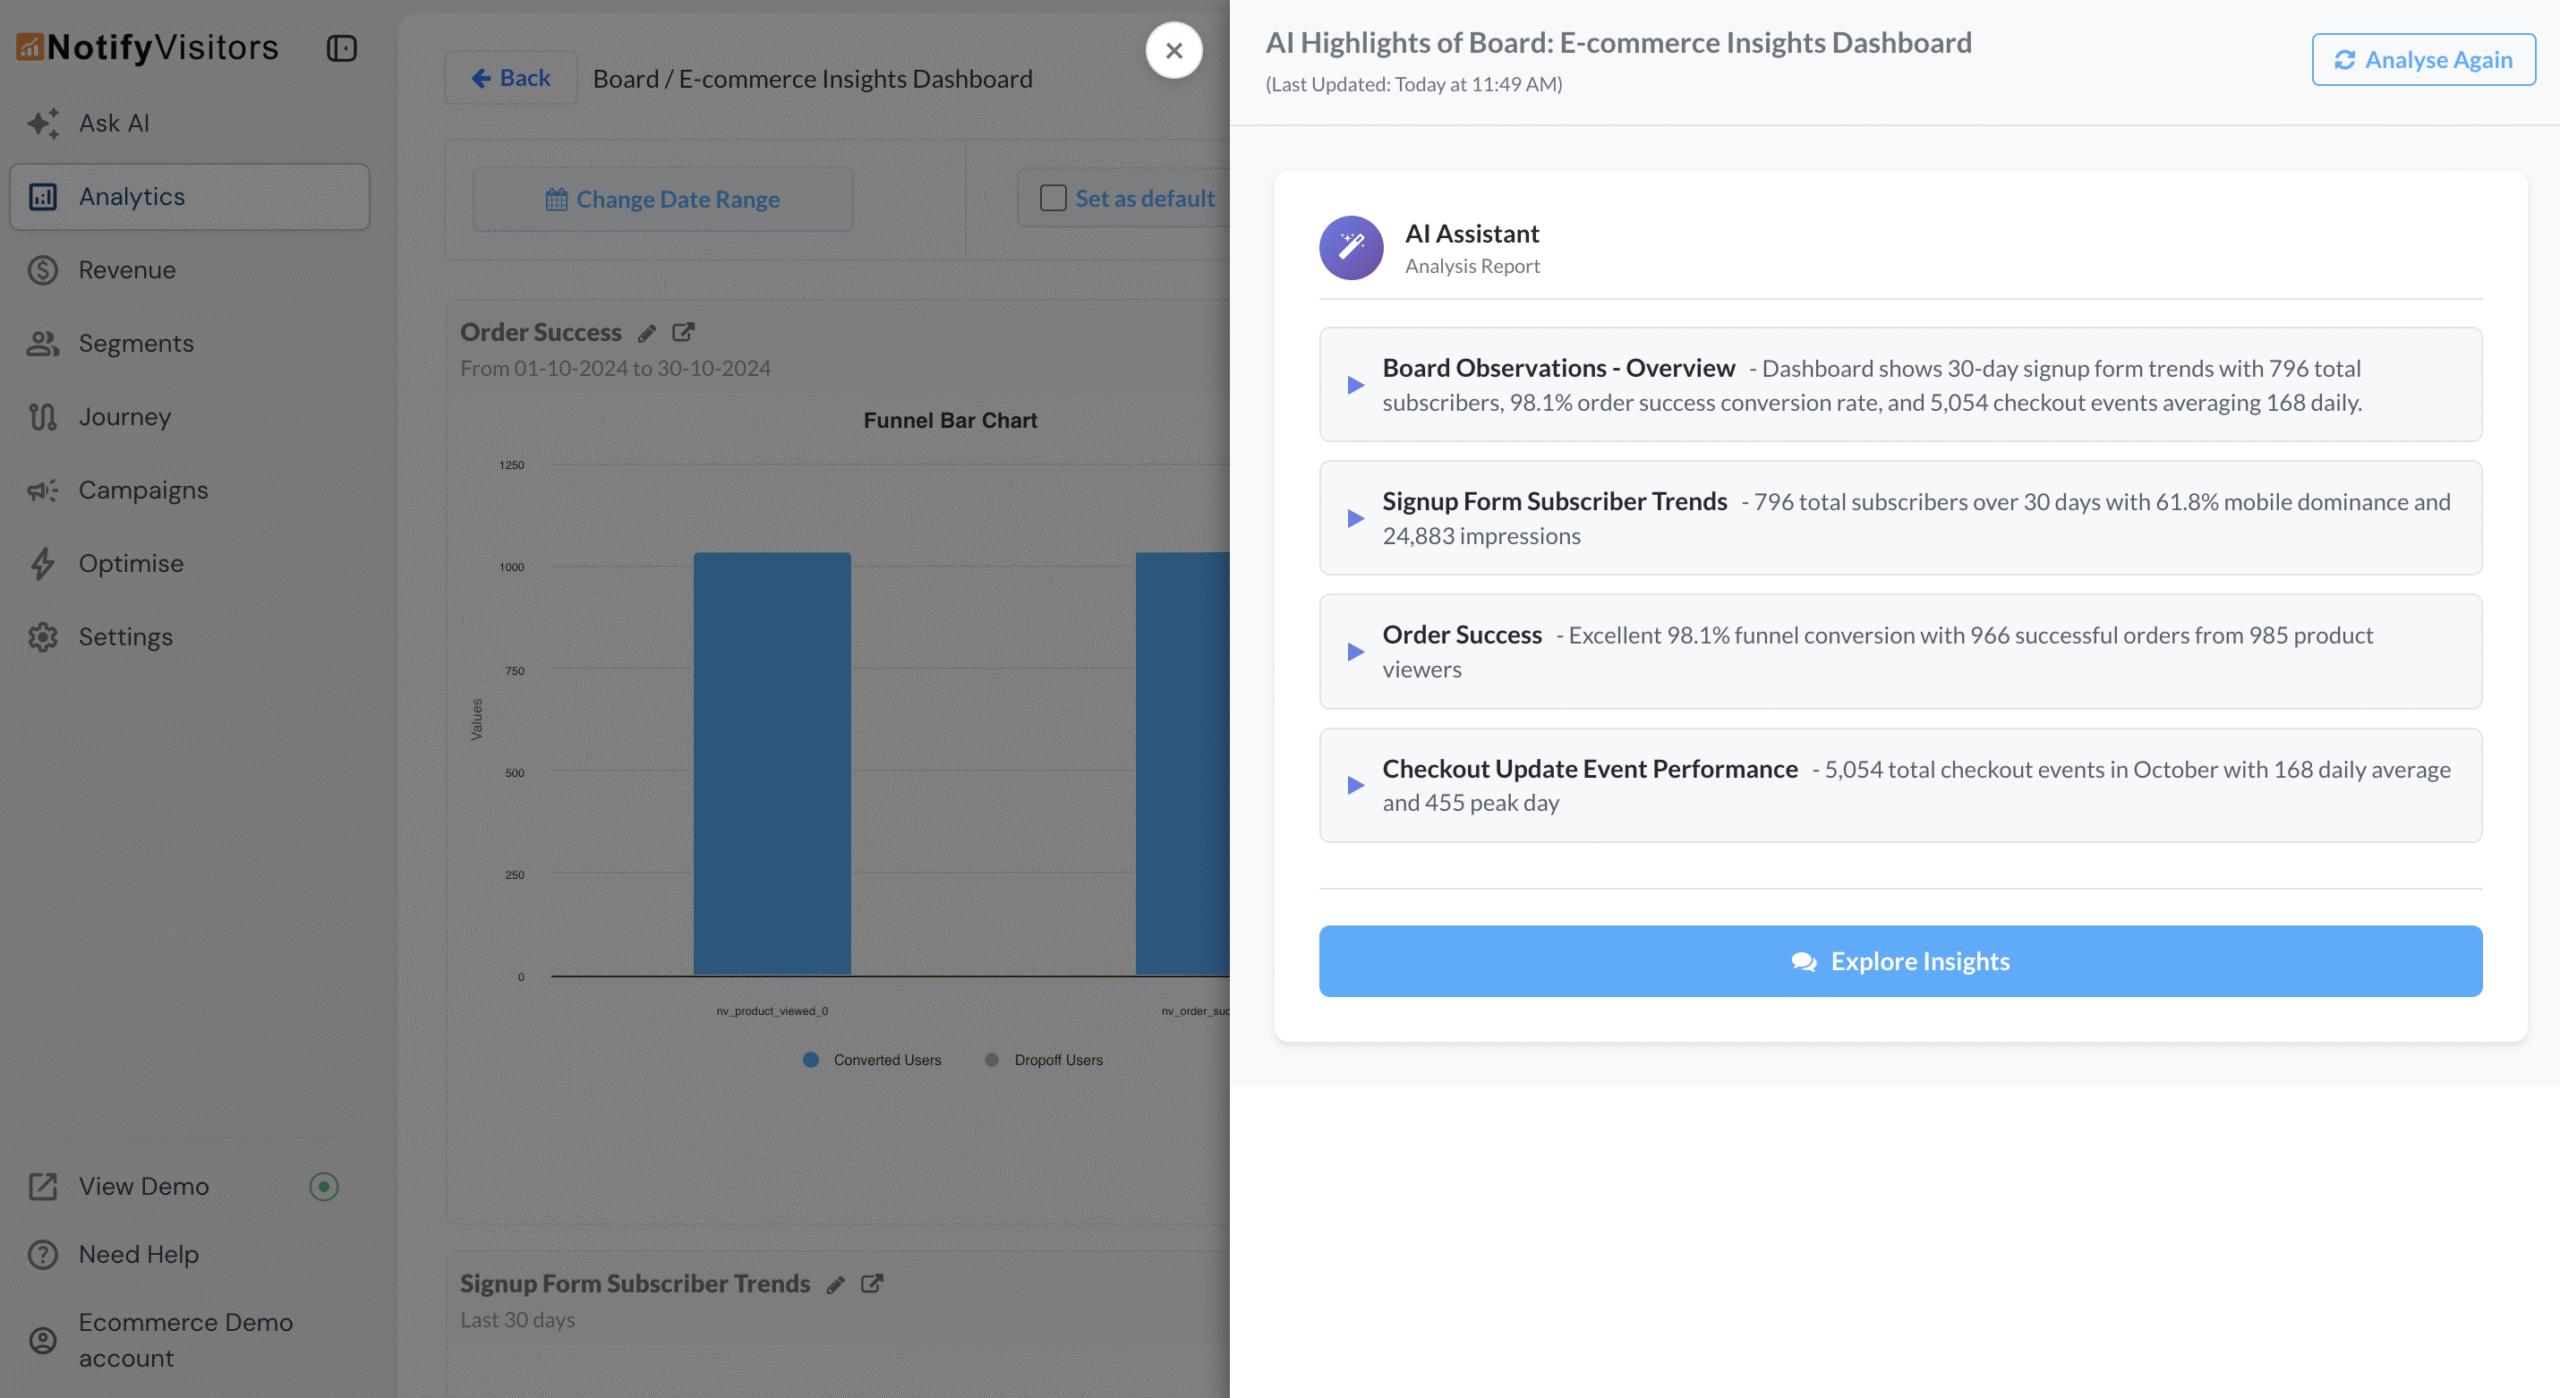
To ask follow-up or cross-card questions, click Explore Insights. This opens the AI copilot with same data for conversational queries over it.
The AI report is cached for 24 hours; if you need fresh results immediately, click Analyze Again to re-run the summary on-demand.
Problem it solves
Custom boards provide rich metrics, but extracting the signal, the “what changed and why”, takes time. AI Highlights reduces cognitive overhead by turning multi-card dashboards into a concise narrative and surfacing the most important data points, enabling non-analysts to understand board takeaways and analysts to focus on investigation and action.